Gold has officially entered bear market territory, with prices hovering near $4,489 per ounce as of Monday morning, a staggering decline of more than $1,100 from the all-time high of $5,589 struck on January 29, 2026. The brutal sell-off, which has accelerated over the past three weeks, marks one of the sharpest corrections the yellow metal has seen in years, wiping out hundreds of billions in market value across gold miners, streamers, and ETFs.
From Record High to Bear Market: A Timeline
Gold’s record-breaking run in early 2026 was fueled by central bank buying, geopolitical uncertainty, and persistent inflation fears. But the rally stalled violently in mid-March. On March 19, the metal crashed through the psychologically critical $5,000 level, falling to $4,551 per ounce in a single session, its lowest print since early February. A second consecutive day of heavy selling brought prices down to the $4,700 zone, representing roughly a 6% two-day collapse.
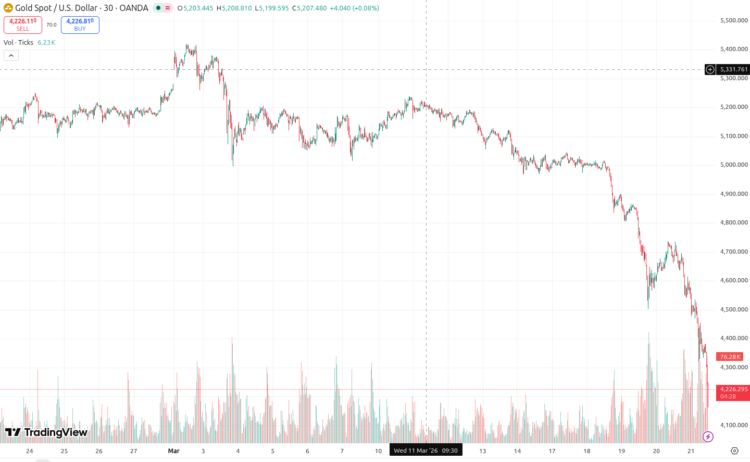
By the weekend of March 21–22, spot gold had slipped further to $4,493 per ounce. As markets reopen this Monday, gold is consolidating near $4,489, with analysts watching the $4,400 level as the next major support.
A technical bear market is formally defined as a decline of 20% or more from a recent peak. Gold has now crossed that threshold decisively.
What’s Driving the Crash?
Several forces converged to trigger the sell-off, and not all of them are the usual suspects:
1. A Hawkish Federal Reserve
The Fed’s decision to hold rates steady while signaling a “higher for longer” stance rattled gold bulls. With U.S. Treasury yields rising on renewed inflation concerns, the opportunity cost of holding non-yielding bullion has become harder to justify. Real yields on 10-year TIPS are hovering near 1.74%, making bonds increasingly competitive with gold.
2. A Surging U.S. Dollar
The dollar index hit a more than 3.5-month high in mid-March. Since gold is priced in dollars, dollar strength mechanically pressures gold prices, particularly when the move is driven by higher yields and risk-off flows. Currency traders are taking notice, and algorithmic gold funds are responding.
3. A Liquidity Event in Leveraged Markets
Ironically, the closure of the Strait of Hormuz, the most destabilizing geopolitical event in decades, initially spiked gold from $5,296 to $5,423, before triggering a hard reversal. Analysts describe the ensuing crash as a “paper market flush.” Institutional traders holding leveraged gold futures and ETF positions faced margin calls and were forced to liquidate, not because gold was fundamentally overvalued, but because they needed fast liquidity. The Iran escalation, which should have been bullish for safe havens, instead became the catalyst for a forced selldown.
4. Reduced Asian Physical Demand
The Middle East conflict has rattled economies across Asia. Analysts note that disruption to major gold-importing nations, India and China, is weighing on jewelry and physical bar demand, a key structural support for gold prices.
Mining Stocks: Carnage Across the Board
The bloodbath has been even more savage in equities. Gold miners, which typically amplify moves in the underlying metal, have been absolutely hammered in March:
- Newmont (NEM): Down 26.3% from pre-war levels; market cap fallen from $143B to $104B
- Barrick Mining (GOLD): Down 26.8%, market cap at $62B (down ~$27B)
- Anglogold Ashanti (AU): Down a staggering 37.4% in March, now at $40B
- Gold Fields (GFI): Off 33.6%, market cap at $35B
- Kinross Gold (KGC): Down 28.3%, now valued at $32B
- Wheaton Precious Metals (WPM): Fallen nearly 30% to $52B
- Silver miner Fresnillo: OTC units down 31.3%, trimming market cap to $30B
Silver has fared even worse than gold, plunging 44% from its January highs. Silver is currently trading near $67.42 per ounce. Copper has also entered bear market territory, down nearly 20% from its all-time high.
Where Is the Floor? Analysts Weigh In
The key technical level analysts are watching is the 200-day exponential moving average near $4,200. Many consider this the bull/bear dividing line – a sustained close below it would open the door to $3,500 in a worst-case scenario.
On the upside, the $4,576–$4,760 range represents immediate resistance, with $5,000 being the level gold bulls need to reclaim to restore confidence.
Longer-term, the structural bull case remains intact for many institutions:
- J.P. Morgan maintains a 2026 gold target of $6,300
- Deutsche Bank sees prices reaching $6,000
- CoinCodex algorithm forecasts gold at roughly $4,025 by March 28 before a longer-term recovery
Central banks are expected to remain net buyers, with J.P. Morgan projecting roughly 755 tonnes of central bank purchases in 2026, elevated compared to pre-2022 norms, even if below the record pace of recent years.
Bear Market or Correction? The Bigger Picture
Gold went on a historic run in 2025, surging approximately 55% and crossing $4,000 per ounce for the first time in October before ultimately reaching $5,589. Every major bull market includes pullbacks that shake out leveraged positions and reset sentiment. Whether this is one of those corrections or the beginning of a deeper structural reversal is the question every gold investor is asking right now.
The structural drivers that fueled gold’s run haven’t disappeared: U.S. fiscal deficits remain wide, central banks are still diversifying away from dollar reserves, and the geopolitical risk premium has arguably never been higher. But the market is also signaling that at $5,500+, gold had gotten ahead of itself and that a repricing was overdue.
For now, the $4,400 level is the line in the sand. A hold above this zone could set up a recovery toward $5,000. A break below it, especially if driven by further dollar strength or a Fed pivot toward rate hikes, could invite a deeper test of the $4,000 zone.
What This Means for Crypto Investors
Gold’s bear market has arrived at a curious moment for the broader digital assets ecosystem. Bitcoin, long marketed as “digital gold,” is being watched closely. Historically, periods of gold weakness driven by dollar strength and rising real yields have also pressured Bitcoin. However, if this correction is ultimately driven by forced liquidation rather than a fundamental shift in the macro backdrop, crypto markets may decouple, particularly if institutional players rotate from precious metals into higher-risk assets.
The coming week’s U.S. PMI data, jobless claims, and Fed speakers will be critical in determining whether gold stabilizes or accelerates lower. With the PCE inflation report rescheduled to April 9, markets are flying somewhat blind on the inflation picture which adds to uncertainty across all asset classes, crypto included.
Note: All price data sourced from live market feeds as of March 23, 2026.


