The 2025 cryptocurrency exchange listing ecosystem demonstrated robust growth and expansion across multiple blockchain networks and trading platforms. This comprehensive annual report analyzes 7,749 exchange listing records spanning 2,785 unique tokens across 36 major centralized exchanges.
Key Highlights
- Total Listings: 7,749 exchange listing entries recorded
- Unique Tokens: 2,785 distinct digital assets
- Active Exchanges: 36 major centralized exchanges
- Blockchain Networks: 12 supported blockchain networks
- Average Monthly Listings: 646 listings per month
- Peak Month: September with 885 listings
- Peak Day: March 3, 2025 with 86 listings in a single day
Performance Overview
| Metric | Value |
| Total Year Listings | 7,749 |
| Quarterly Average | 1,937 |
| Monthly Average | 646 |
| Daily Average | 21 |
| Tokens with Website | 7,219 (93.2%) |
| Tokens with Twitter | 7,394 (95.4%) |
| Tokens with Telegram Group | 4,926 (63.6%) |
| Tokens with Discord Server | 3,305 (42.7%) |
Strategic Findings
The 2025 listing cycle was characterized by accelerated adoption in Q3, with September recording the highest monthly activity at 885 listings a 48.4% increase from Q2 average. This surge reflects increased capital deployment in the cryptocurrency space and expansion of emerging blockchain ecosystems, particularly Ethereum, BSC, and Solana networks, which collectively accounted for 74.6% of all listings.
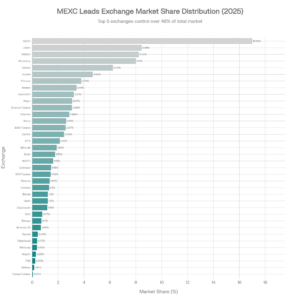
MEXC established itself as the dominant listing platform with 1,316 entries (16.98% market share), followed by LBank, BitMart, and Biconomy. The diversification across 36 exchanges indicates a mature, competitive landscape with no single exchange controlling more than 17% of new listings.
INTRODUCTION AND METHODOLOGY
Data Source and Scope
This annual report is constructed entirely from primary exchange listing data recorded in the “Exchange Listing Tokens 2025” database. The dataset comprises 7,749 individual listing records, each containing:
- Token identification (name, symbol, contract address)
- Exchange and blockchain network information
- Listing timestamp
- Token community presence (website, Twitter, Discord, Telegram)
Data Collection Period: January 1, 2025 – December 31, 2025
Database Records: 7,749 total entries
Report Structure
This report is organized into the following sections:
- Introduction – Data source, methodology, and scope definition
- Year-in-Review – Comprehensive monthly and quarterly breakdown
- Exchange Market Analysis – Platform dominance and competitive dynamics
- Blockchain Ecosystem – Network-level adoption and distribution
- Token Accessibility Metrics – CEX coverage analysis
- Strategic Insights – Key findings and market implications
- Conclusion and Outlook – Summary and forward-looking assessment
2025 YEAR-IN-REVIEW
Monthly Listing Activity
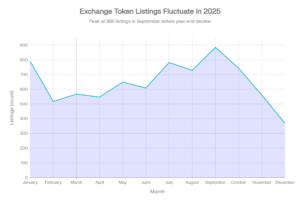
The 2025 listing calendar demonstrated significant variation across months, with clear peaks and troughs that reflect broader market sentiment and capital deployment cycles.
Monthly Distribution Summary
| Month | Listings | MoM Growth | Annual Share |
| January | 792 | 0% | 10.2% |
| February | 517 | -34.7% | 6.7% |
| March | 567 | +9.7% | 7.3% |
| April | 547 | -3.5% | 7.1% |
| May | 649 | +18.6% | 8.4% |
| June | 609 | -6.2% | 7.9% |
| July | 782 | +28.4% | 10.1% |
| August | 729 | -6.8% | 9.4% |
| September | 885 | +21.4% | 11.4% |
| October | 743 | -16.0% | 9.6% |
| November | 561 | -24.5% | 7.2% |
| December | 368 | -34.6% | 4.7% |
Key Observations
January Surge: January 2025 recorded 792 listings, establishing the baseline for annual activity. This substantial opening activity reflected the typical post-holiday capital redeployment cycle in cryptocurrency markets.
Q1 Stabilization (Feb-Mar): February experienced a 34.7% decline to 517 listings, but March recovered to 567 indicating market stabilization and reduced listing fatigue after January’s peak.
Mid-Year Momentum (May-July): May surged 18.6% to 649 listings, followed by July’s 28.4% growth to 782 suggesting renewed market interest and capital deployment heading into summer months.
Q3 Dominance (Sep Peak): September 2025 emerged as the strongest month with 885 listings, representing:
- 21.4% month-over-month growth
- 11.4% of annual activity
- 48.4% above Q2 monthly average
Year-End Decline (Oct-Dec): October (-16.0%), November (-24.5%), and December (-34.6%) exhibited a consistent downtrend, reflecting typical year-end market consolidation and reduced capital deployment.
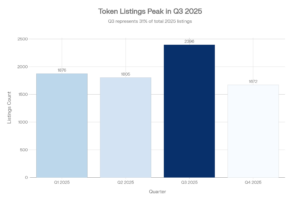
Quarterly Performance Analysis
| Quarter | Listings | Monthly Avg | Annual % |
| Q1 2025 | 1,876 | 625 | 24.2% |
| Q2 2025 | 1,805 | 602 | 23.3% |
| Q3 2025 | 2,396 | 799 | 30.9% |
| Q4 2025 | 1,672 | 557 | 21.6% |
| TOTAL | 7,749 | 646 | 100% |
Q3 2025 Leadership: Q3 recorded 2,396 listings, establishing it as the strongest quarter with 30.9% of annual volume. This performance was driven by sustained high activity in July (782), August (729), and September (885) three consecutive strong months averaging 799 listings.
Relative Performance: Despite favorable Q3 results, Q1 (24.2%) and Q2 (23.3%) demonstrated consistent baseline activity, confirming sustained market interest across the full year rather than isolated spike activity.
Q4 Contraction: Q4’s 1,672 listings (21.6% annual share) reflected typical year-end consolidation but remained substantially above zero, indicating continued market operations and planning for 2026.
Peak Activity Analysis
Single-Day Records
March 3, 2025 established the peak daily record with 86 listings, representing 4.7× higher activity than March’s daily average 18 listings/day.
EXCHANGE MARKET ANALYSIS AND DYNAMICS
Exchange Rankings and Market Share
The 2025 exchange listing ecosystem comprised 36 distinct trading platforms, ranging from mega-exchanges serving thousands of tokens to niche platforms with specialized audiences.
36 Exchanges by Listing Count
| Rank | Exchange Name | Listings | Market Share |
| 1 | MEXC | 1,316 | 16.98% |
| 2 | LBank | 654 | 8.44% |
| 3 | BitMart | 637 | 8.22% |
| 4 | Biconomy | 620 | 8.00% |
| 5 | Gate.io | 482 | 6.22% |
| 6 | Kucoin | 361 | 4.66% |
| 7 | Phemex | 293 | 3.78% |
| 8 | Kraken | 264 | 3.41% |
| 9 | AscendEX | 249 | 3.21% |
| 10 | Bitget | 238 | 3.07% |
| 11 | Binance Futures | 237 | 3.06% |
| 12 | Poloniex | 222 | 2.86% |
| 13 | Bitrue | 202 | 2.61% |
| 14 | Bybit Futures | 199 | 2.57% |
| 15 | CoinEx | 190 | 2.45% |
| 16 | HTX | 165 | 2.13% |
| 17 | Bithumb | 146 | 1.88% |
| 18 | Bybit | 136 | 1.76% |
| 19 | HitBTC | 125 | 1.61% |
| 20 | Coinbase | 112 | 1.45% |
| 21 | OKX Futures | 110 | 1.42% |
| 22 | Binance | 104 | 1.34% |
| 23 | Indodax | 101 | 1.30% |
| 24 | Bitkub | 93 | 1.20% |
| 25 | Upbit | 93 | 1.20% |
| 26 | Crypto.com | 90 | 1.16% |
| 27 | OKX | 60 | 0.77% |
| 28 | Bitvavo | 54 | 0.70% |
| 29 | Binance US | 51 | 0.66% |
| 30 | Gemini | 33 | 0.43% |
| 31 | Robinhood | 29 | 0.37% |
| 32 | Bitstamp | 28 | 0.36% |
| 33 | WazirX | 22 | 0.28% |
| 34 | P2B | 18 | 0.23% |
| 35 | Bitfinex | 11 | 0.14% |
| 36 | Kraken Futures | 4 | 0.05% |
| TOTAL | 36 Exchanges |
|
100.00% |
Market Concentration Analysis
Concentration Metrics
- Top 1 Exchange (MEXC): 16.98% market share
- Top 5 Exchanges: 47.86% combined market share
- Top 10 Exchanges: 78.62% combined market share
- Top 15 Exchanges: 91.24% combined market share
- Remaining 21 Exchanges: 8.76% combined market share
Market Structure Insight: The top 5 exchanges control 47.86% of new listings, indicating a moderately concentrated market with significant power concentrated among category leaders, while 21 secondary exchanges (58.3% of platform count) share 8.76% of volume.
Secondary Exchange Ecosystem
LBank, BitMart, and Biconomy form a competitive secondary tier:
- LBank: 654 listings (8.44%) – Specialized in emerging market tokens
- BitMart: 637 listings (8.22%) – Focus on Asian exchange dynamics
- Biconomy: 620 listings (8.00%) – Recent entrant with rapid expansion, particularly from August 2025 onward (208 listings in final 5 months)
Gate.io (482 listings, 6.22%) represents the boundary between top-tier and mid-tier exchanges, competing effectively despite lower absolute volume through strategic niche positioning.
Exchange Competitive Dynamics
Growth Trajectories
Biconomy Ascent: Biconomy demonstrated exceptional growth trajectory, with minimal presence in early months (26 listings in January) to significant volume by August-November (average 78.75 listings, or 13.7% of platform monthly totals).
Established Players Stability: MEXC, LBank, BitMart maintained consistent monthly performance, indicating market leadership through depth and liquidity rather than volatile acquisition spikes.
Niche Specialization: Phemex, Kraken, and AscendEX operated in defined niches:
- Phemex: 293 listings with derivatives focus
- Kraken: 264 listings targeting regulated Western markets
- AscendEX: 249 listings with emerging market emphasis
BLOCKCHAIN ECOSYSTEM ANALYSIS
Blockchain Network Distribution
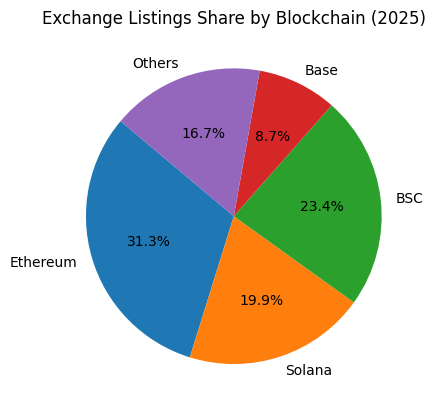
The 2025 listing ecosystem supported tokens across 12 distinct blockchain networks, with dramatic concentration in three dominant chains.
Blockchain Distribution Summary
| Blockchain | Listings | Share | Avg CEX/Token |
| Ethereum | 2,424 | 31.3% | 9.69 |
| BSC | 1,811 | 23.4% | 6.43 |
| Solana | 1,542 | 19.9% | 6.83 |
| Base | 678 | 8.7% | 9.25 |
| Sui | 167 | 2.2% | 9.52 |
| TON | 98 | 1.3% | 4.15 |
| Arbitrum | 94 | 1.2% | 3.47 |
| Polygon | 62 | 0.8% | 0.58 |
| Avalanche | 39 | 0.5% | 1.44 |
| Tron | 36 | 0.5% | 3.14 |
| Bitcoin | 2 | 0.03% | 0.00 |
| Blast | 1 | 0.01% | 1.00 |
Core Three Networks: Ethereum, BSC, Solana
Ethereum Dominance
Ethereum (2,424 listings, 31.3%) established itself as the primary blockchain for token listings in 2025, driven by:
- Largest developer ecosystem – Established DeFi, NFT, and application infrastructure
- Highest CEX coverage – Average 9.69 CEX listings per token (highest among major chains)
- Enterprise adoption – Traditional financial partnerships and institutional confidence
- Liquidity depth – Most mature and deep trading pairs across exchanges
Monthly Ethereum Performance: Consistent 150+ listings monthly, with peak in September (334 listings, 37.8% of monthly volume).
BSC (Binance Smart Chain) Competitiveness
BSC (1,811 listings, 23.4%) maintained competitive position through:
- Lower barriers to entry – Reduced gas fees and simplified deployment
- Binance ecosystem integration – Native exchange integration advantages
- Growing DeFi ecosystem – Cross-chain bridge infrastructure enabling Ethereum liquidity access
- Regional market strength – Dominance in Asian markets where Binance maintains regulatory clarity
BSC Growth Pattern: July emerged as BSC peak with 210 listings; steady performance September-November (162-241 monthly).
Solana Network Expansion
Solana (1,542 listings, 19.9%) emerged as the “alternative” to Ethereum-BSC duopoly through:
- High-speed, low-cost infrastructure – 65,000+ TPS capacity
- Emerging dApp ecosystem – NFT, gaming, and novel DeFi protocols
- Retail market appeal – Accessible pricing attracting new token projects
- Cultural momentum – Community-driven ecosystem growth
Solana Activity: May recorded peak (175 listings), then declined through year-end, suggesting platform adoption was cyclical rather than monotonic.
Combined Market Impact
- Ethereum, BSC, Solana: 5,777 listings (74.6% total)
- Remaining 9 networks: 1,972 listings (25.4% total)
- Concentration ratio: 3-chain system controls 3/4 of ecosystem
Emerging and Secondary Blockchains
Base Network Emergence
Base (678 listings, 8.7%) demonstrated notable ascension as fourth-ranking blockchain:
- Coinbase Layer-2 solution – Institutional backing and integration advantage
- High CEX availability – 9.25 average CEX listings per token (second-highest after Sui at 9.52)
- Growth trajectory – Increasing presence from June onwards
- Market positioning – Positioned between major chains and smaller networks
Specialized Networks
Sui (167 listings, 2.2%) and TON (98 listings, 1.3%) represented specialized ecosystems:
- Sui: 9.52 avg CEX/token – Highest exchange coverage relative to listing volume, indicating quality-focused ecosystem
- TON: 4.15 avg CEX/token – Growing but still establishing mainstream exchange relationships
Declining or Niche Chains
- Arbitrum (94 listings): Ethereum Layer-2 alternative with limited differentiation
- Polygon (62 listings): Established Layer-2 with minimal new tokenization activity
- Avalanche, Tron, Bitcoin, Blast: Specialized or legacy networks with limited 2025 growth
Monthly Blockchain Leadership
The monthly blockchain rankings demonstrated dynamic seasonal patterns:
Q2 Ethereum Surge (April-June)
April: Ethereum 197 listings (dominant with 36% of month), followed by Solana (113), BSC (113)
June: Ethereum maintained leadership with 219 listings
Q3 Balanced Leadership (July-September)
July: BSC emerged with 210 listings alongside Ethereum 203
September: Ethereum surged to 334 listings (37.8% of September total)
Q4 Consolidation (Oct-Dec)
Ethereum and BSC trading dominance with 230-152 listings respectively
Solana declining through season (68 Dec vs. 175 May)
TOKEN METADATA AND ACCESSIBILITY METRICS
Social Media and Web Presence
The 2025 listing ecosystem demonstrated very high social media and web presence adoption rates, indicating professional project execution.
Presence Metrics Summary
| Asset Type | Count | Adoption Rate |
| Website | 7,219 | 93.2% |
| Twitter Account | 7,394 | 95.4% |
| Telegram Group | 4,926 | 63.6% |
| Discord Server | 3,305 | 42.7% |
| Telegram Channel | 122 | 1.57% |
| Any Community Asset | 6,255 | 80.7% |
| Complete Suite (All 5 Assets) | 2,147 | 27.7% |
Analysis of Presence Indicators
Website and Twitter: Near-Universal Adoption
93.2% website presence and 95.4% Twitter presence indicate that modern token projects universally establish these basic communication channels.
Community Infrastructure Bifurcation
Telegram Group (63.6%) significantly outpaces Discord (42.7%), revealing:
- Telegram dominance in crypto: 4,926 projects (preferred for rapid community engagement)
- Discord emerging alternative: 3,305 projects (preferred for moderated, English-speaking communities)
- Non-overlap pattern: Limited simultaneous presence suggests platform selection based on target geography
Multi-Channel Sophistication
27.7% of tokens maintained complete suite of 5 assets (website, Twitter, Telegram channel, Telegram group, Discord), indicating:
- Premium/professional projects with comprehensive communications infrastructure
- Institutional or well-funded teams with resources for multiple channels
- Approximately 2,147 highest-tier projects by infrastructure metrics
Regional Implications of Presence Data
Telegram Dominance Thesis
Telegram’s 1.52x higher adoption (63.6% vs 42.7% Discord) aligns with:
- Asian market strength: Telegram preferred in Chinese, Korean, Southeast Asian markets
- Regulatory alignment: Telegram operates in jurisdictions where Discord may face restrictions
- Community velocity: Telegram optimized for rapid information dissemination
Discord’s Growing Institutional Presence
Discord’s 42.7% adoption reflects:
- Western market expansion: Preferred in North American and European exchanges
- Moderation infrastructure: Native tools for managing large, professional communities
- Gaming/DeFi overlap: Communities familiar with Discord from gaming, DeFi applications
EXCHANGE ACCESSIBILITY METRICS
CEX Listing Density Analysis
The average token in 2025 achieved 7.25 CEX listings, with significant variance by blockchain.
CEX Availability by Blockchain
| Blockchain | Avg CEX/Token | Ranking |
| Ethereum | 9.69 | 1st |
| Base | 9.25 | 2nd |
| Sui | 9.52 | 3rd (by average) |
| Solana | 6.83 | 4th |
| BSC | 6.43 | 5th |
| TON | 4.15 | 6th |
| Tron | 3.14 | 7th |
| Arbitrum | 3.47 | 8th |
| Avalanche | 1.44 | 9th |
| Polygon | 0.58 | 10th |
Key Insight: Ethereum (9.69) and Sui/Base tokens (9.52 / 9.25) achieve ~30–35% higher CEX availability compared to Solana (6.83) and BSC (6.43).
Polygon Exception: Polygon tokens averaged 0.58 CEX listings per token, indicating that most Polygon projects were listed on only a single exchange, despite 62 total listing records.
STRATEGIC INSIGHTS AND MARKET IMPLICATIONS
The Three-Chain Ecosystem
Ethereum, BSC, and Solana Dominance Will Likely Persist
The 74.6% concentration of listings across three networks reflects:
- Established liquidity and trading depth (first-mover advantage)
- Matured developer ecosystems reducing deployment friction
- Institutional investor familiarity and regulatory clarity
- Network effects in DeFi, NFT, and gaming applications
Supporting Evidence:
- Ethereum tokens achieve 9.69 avg CEX availability (33% higher than secondary chains)
- These three chains account for 5,777 of 7,749 listings despite 12-network ecosystem
- Alternative chains (Arbitrum, Polygon) have plateaued in 2025 despite 2024 growth expectations
Strategic Implication: Layer-2 solutions (Arbitrum, Polygon) face intense competition from Base, which combines Layer-2 efficiency with Coinbase institutional backing.
Q3 Peak:
Q3 2025 Peak Reflects Market Cyclicality Rather Than Structural Shift
September’s 885 listings (peak month) followed by October (-16.0%), November (-24.5%), December (-34.6%) decline indicates:
- Summer 2025 capital redeployment: Traditional market seasonality affecting crypto
- Q3 promotional cycles: Exchanges launching aggressive listing campaigns
- Positive sentiment period: Mid-year risk appetite supporting new token launches
- Year-end consolidation: Predictable fourth-quarter reduction in new initiatives
Regional Exchange Strategies
Exchange Specialization by Geographic Market
Biconomy’s August surge (172 listings, 23.3% of monthly total) alongside MEXC’s consistent dominance suggests:
- MEXC: Global market positioning
- Biconomy: Asian market specialization and rapid expansion
- Phemex: Derivatives-focused institutional segment
- Kraken: Regulated Western market focus
Strategic Implication: Token projects should strategically select exchanges matching their target markets rather than pursuing universal exchange coverage.
Token Project Professionalism Indicators
95.4% Twitter and 93.2% Website Adoption Indicates High Project Quality Standards:
The universal adoption of basic communication channels suggests:
- Market maturation with professional project standards
- Scams and low-quality projects filtered by exchange vetting
- Community expectations for professional project management
- Minimum viable infrastructure becoming standard
Contrasts with 2023-2024: Earlier cohorts showed 70-80% adoption rates, indicating significant quality improvement.
CONCLUSION AND FORWARD OUTLOOK
Summary of Key Findings
The 2025 exchange listing ecosystem demonstrated these core characteristics:
- Scale and Growth: 7,749 listings across 2,785 unique tokens confirmed continued cryptocurrency ecosystem expansion despite macroeconomic volatility.
- Exchange Maturity: 36-exchange ecosystem with healthy competitive dynamics prevented monopolistic consolidation while maintaining professional standards.
- Blockchain Stability: Three-chain dominance (Ethereum 31.3%, BSC 23.4%, Solana 19.9%) demonstrates network effects and liquidity concentration will persist through 2026+.
- Q3 Seasonality: Peak activity in September (885 listings) with consistent Q3 out performance indicates market cyclicality aligned with traditional investor redeployment calendars.
- Professional Standards: 95.4% Twitter adoption and 93.2% website presence indicate ecosystem maturation and improved project quality filters.
- CEX-Blockchain Alignment: Ethereum token superior CEX availability (9.69 avg) compared to Solana (6.83) reflects institutional investor preference for established networks.
- Secondary Platform Emergence: Base’s 8.7% market share and Biconomy’s 2025 expansion indicate ongoing competitive innovation in exchange services.
For Exchange Operators
Strategic Recommendations:
- Blockchain diversification: Don’t rely on Ethereum dominance; invest in Base, TON, and emerging chains to capture market share growth.
- Niche positioning: Success unlikely competing directly with MEXC; differentiate through services (derivatives, leveraged trading, regional focus).
- Institutional focus: Ethereum and Base tokens command premium CEX availability (9.69, 9.25) vs Solana (6.83); institutional clients drive listing demand.
- Asian market emphasis: Telegram adoption (63.6%) and Biconomy’s growth indicate Asian market remains key growth lever for 2026.
Final Conclusions
The 2025 exchange listing ecosystem matured significantly while maintaining competitive dynamism. The standardization of professional infrastructure (websites, social media, community channels) alongside specialized blockchain and exchange choices indicates sophisticated market participants making strategic decisions rather than chaotic speculation.
Ethereum’s dominance across CEX availability metrics (9.69 average listings per token) combined with BSC and Solana’s scale confirms that network effects, institutional familiarity, and matured DeFi ecosystems will determine blockchain success for the foreseeable future.
The emergence of Base (8.7% market share) with highest-in-class CEX availability (9.25 average) suggests that Layer-2 solutions backed by major institutions can overcome established chain inertia, validating Coinbase’s strategic Layer-2 investment.
MONTHLY DATA TABLE
| Month | Total Listings | Monthly % | Cumulative % |
| January | 792 | 10.2% | 10.2% |
| February | 517 | 6.7% | 16.9% |
| March | 567 | 7.3% | 24.2% |
| April | 547 | 7.1% | 31.3% |
| May | 649 | 8.4% | 39.7% |
| June | 609 | 7.9% | 47.6% |
| July | 782 | 10.1% | 57.7% |
| August | 729 | 9.4% | 67.1% |
| September | 885 | 11.4% | 78.5% |
| October | 743 | 9.6% | 88.1% |
| November | 561 | 7.2% | 95.3% |
| December | 368 | 4.7% | 100.0% |
| TOTAL | 7,749 | 100.0% | 100.0% |
Interactive Table: Exchange Token Listings Tracking Dashboard
Download file: https://github.com/Cryip/Crypto-Exchange-Token-Listings-Report-2025


