
January 2026 delivered a mixed bag for the blockchain industry. While Solana posted impressive gains in Total Value Locked (TVL) and transaction activity, both Bitcoin and Ethereum experienced notable pullbacks from mid-month highs. This monthly recap breaks down the key performance metrics across five major blockchain ecosystems Ethereum, Solana, BSC, Bitcoin, and Tron.
Market Overview: A Tale of Divergence
The month started strong across most chains, with market optimism driving TVL growth and increased DeFi activity through mid-January. January 15 emerged as a pivotal date, marking the peak for Bitcoin ($97,008), Ethereum ($3,356), and Solana ($146.71) token prices. However, the second half of the month saw a correction that erased many of those gains.
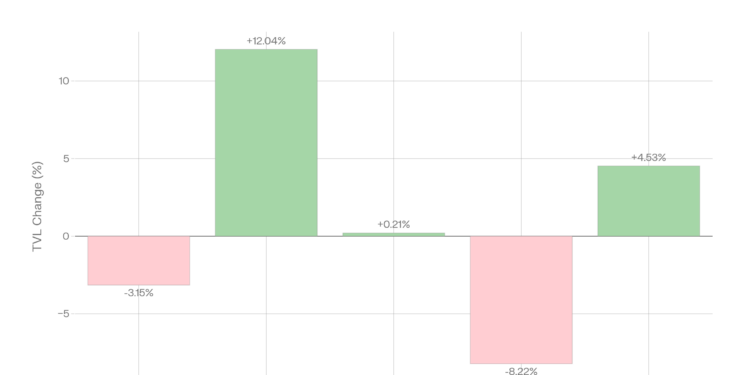
Despite the late-month pullback, Solana emerged as the clear winner with a 12.04% TVL increase, while Bitcoin saw the steepest decline at -8.22%. Ethereum’s TVL dropped 3.15%, while BSC held relatively steady (+0.21%) and Tron posted modest growth (+4.53%).
Ethereum: DeFi Leader Faces Headwinds
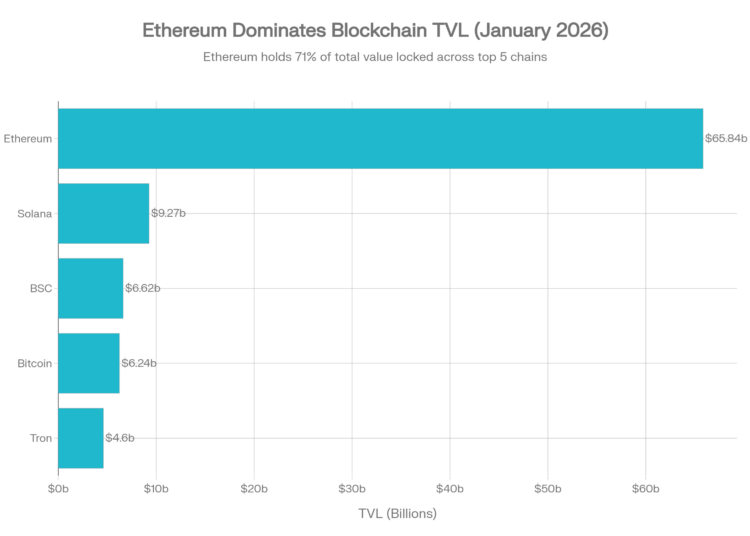
Ethereum maintained its dominant position in Total Value Locked, ending January at $65.84 billion far ahead of its competitors. However, the network experienced a 3.15% TVL decline from its $67.98 billion starting point.
Key Ethereum Metrics:
| Metric | Start of Month | End of Month | Change |
| TVL | $67.98B | $65.84B | -3.15% |
| ETH Price | $2,967 | $2,702 | -8.93% |
| Active Addresses | 697,632 | 740,446 | +6.14% |
| Monthly DEX Volume | $52.82B |
Source: Defillama Ethereum


Ethereum’s DEX volume reached $52.82 billion for the month, demonstrating sustained DeFi activity despite price volatility. Active addresses grew 6.14%, hitting a monthly peak of 1.15 million daily users. The network processed approximately 69.78 million transactions throughout January.
Chain fees surged dramatically (+618%), reflecting increased demand during peak activity periods around January 14-16.
Solana: The Standout Performer
Solana delivered the strongest performance among all chains analyzed. TVL climbed from $8.27 billion to $9.27 billion (+12.04%), reaching a monthly high of $9.35 billion on January 30.
Key Solana Metrics:
| Metric | Start of Month | End of Month | Change |
| TVL | $8.27B | $9.27B | +12.04% |
| SOL Price | $124.52 | $117.30 | -5.80% |
| Active Addresses | 1.8M | 2.67M | +48.33% |
| Monthly DEX Volume | $117.64B |
Source: Defillama Solana
The most striking figure: Solana processed 2.39 billion transactions in January alone more than 34x Ethereum’s transaction count. This throughput advantage continued driving adoption, with daily active addresses surging 48.33% to hit peaks above 3 million.
Solana’s DEX ecosystem generated $117.64 billion in monthly volume, surpassing Ethereum’s $52.82 billion by more than 2x. This dominance in trading activity reflects Solana’s strength in memecoin trading and DeFi speculation.
Bitcoin: Pullback from All-Time High Territory
Bitcoin saw significant volatility in January, reaching a monthly price peak of $97,008 on January 15 before retreating to $84,142 by month’s end a 3.86% decline from the opening price of $87,520.
Key Bitcoin Metrics:
| Metric | Start of Month | End of Month | Change |
| TVL | $6.80B | $6.24B | -8.22% |
| BTC Price | $87,520 | $84,142 | -3.86% |
| Active Addresses | 570,904 | 702,918 | +23.12% |
| Monthly Token Volume | $79.52B (peak day) |
Source: Defillama Bitcoin
Bitcoin’s TVL dropped 8.22% the largest decline among the five chains falling from $6.80 billion to $6.24 billion. However, network engagement improved, with active addresses increasing 23.12% and chain fees rising 42% throughout the month.
Trading volume showed extreme variability, with the end-of-month daily volume reaching $79.52 billion, representing a 113% increase from the month’s opening day.
BSC: Steady and Consistent
Binance Smart Chain demonstrated remarkable stability in January, with TVL essentially flat at $6.62 billion (+0.21%). The chain avoided the volatility that affected Ethereum and Bitcoin.
Key BSC Metrics:
| Metric | Value |
| TVL (End of Month) | $6.62B |
| Monthly DEX Volume | $51.26B |
| Monthly Transactions | 508.51M |
| Avg Daily Active Addresses | 2.70M |
Source: Defillama BSC
BSC maintained strong user engagement with 2.70 million average daily active addresses higher than Ethereum. Monthly DEX volume of $51.26 billion was competitive with Ethereum, while perpetual futures volume contributed an additional $15 billion throughout the month.
Bridged TVL remained substantial, averaging around $45 billion, indicating significant cross-chain capital flow into the BSC ecosystem.
Tron: Stablecoin Stronghold
Tron continued its role as a stablecoin-focused blockchain, with stablecoin market cap growing from $82.17 billion to $84.56 billion (+2.91%). TVL increased 4.53% to reach $4.60 billion.
Key Tron Metrics:
| Metric | Start of Month | End of Month | Change |
| TVL | $4.40B | $4.60B | +4.53% |
| TRX Price | $0.28 | $0.29 | +3.57% |
| Active Addresses | 2.80M | 3.41M | +21.79% |
| Stablecoin Mcap | $82.17B | $84.56B | +2.91% |
Source: Defillama Tron
Tron led all chains in average daily active addresses at 3.24 million, underscoring its popularity for low-cost stablecoin transfers. The network processed 341.93 million transactions in January, with chain fees remaining economically sustainable for users.
Key Takeaways
- Solana’s momentum is undeniable With 12% TVL growth, 2.4 billion monthly transactions, and over $117 billion in DEX volume, Solana has cemented its position as the go-to chain for high-frequency trading activity.
- Ethereum retains DeFi dominance Despite a TVL decline, Ethereum’s $65.84 billion in locked value is 7x larger than Solana’s, maintaining its status as the premier smart contract platform.
- Bitcoin’s near-$100K rally reversed The mid-month surge to $97,008 attracted significant capital, but the subsequent 13% pullback suggests resistance near the $100,000 psychological barrier.
- Tron’s stablecoin use case grows With $84.56 billion in stablecoin market cap and the highest daily active addresses, Tron remains the dominant network for USDT transfers.
- January 15 was the inflection point All major chains recorded peak prices on this date, suggesting a coordinated market-wide correction in the latter half of the month.
These performance trends emerge against the backdrop of a volatile 2025, marked by heightened security incidents and increased exchange listing activity, which helped shape broader market behavior and capital flows entering 2026.
Looking Ahead to February
The late-January pullback has set up interesting dynamics for February. Watch for Bitcoin’s attempt to reclaim $90,000, Ethereum’s battle to stabilize above $3,000, and whether Solana can sustain its TVL growth momentum. With regulatory clarity potentially emerging in Q1 2026 across major markets, chain fundamentals and user engagement metrics will be critical indicators of longer-term positioning.


