
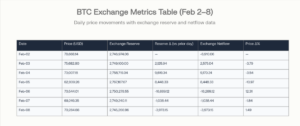
Bitcoin’s on-exchange reserve rose into Feb 5 while price fell hard, then reserves dropped sharply on Feb 6 as price bounced an inversion that defines the week’s most important supply signal. Across Feb 2–8, price slid from 78,668.14 to 70,284.66 (down 10.66%), while exchange reserves ended slightly lower overall (down 0.06%), and cumulative netflow was negative (−8,017.16).
The dataset at a glance
The period starts with BTC at 78,668.14 on Feb 2 and ends at 70,284.66 on Feb 8, with the week’s low at 62,809.26 on Feb 5.
- Exchange reserves ranged from 2,745,266.96 (lowest, Feb 8) to 2,767,167.67 (highest, Feb 5), showing that reserves peaked on the same day price bottomed.
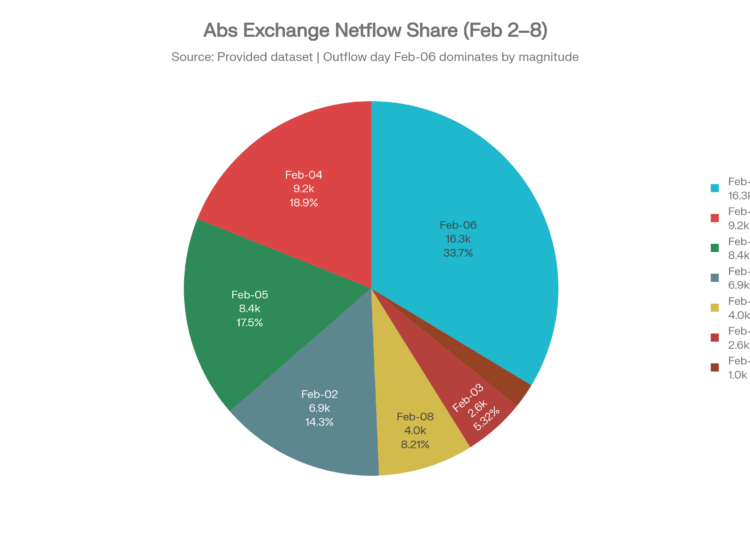
- Netflow flipped repeatedly: three positive days (Feb 3–5) versus four negative days (Feb 2, Feb 6–8), with the largest inflow at +9,170.24 (Feb 4) and the largest outflow at −16,289.12 (Feb 6).
Price shock first, then a supply pullback
From Feb 2 to Feb 5, price dropped in three consecutive steps: −3.79% (Feb 3), −3.54% (Feb 4), then −13.97% (Feb 5), producing the steepest one-day decline of the week on Feb 5. Over that same Feb 2–Feb 5 stretch, exchange reserves increased each day, including two notably large jumps: +9,619.34 on Feb 4 and +8,448.33 on Feb 5.
That combination falling price alongside rising reserves culminated on Feb 5 with the highest reserve (2,767,167.67) and the lowest price (62,809.26), a pairing consistent in this dataset with heightened sell-side availability on exchanges during the drawdown. While retail liquidations often drive these exchange spikes, long-term market stability is frequently bolstered by institutional holdings, such as those seen in Bitcoin Treasuries: Top Public Companies Holding BTC in 2026.
Then the pattern snapped: on Feb 6, price rebounded +12.31% (from 62,809.26 to 70,544.01) while reserves fell −16,889.12, the largest daily reserve drop in the sample. The reserve decline didn’t stop there Feb 7 and Feb 8 saw additional decreases (−1,038.44 and −3,973.15), while price stabilized near 69–70k.
Netflow as the week’s “pressure gauge”
Netflow provides the cleanest day-to-day read in this dataset because it swings strongly around key price moves.
- The selloff window (Feb 3–Feb 5) aligns with sustained positive netflows: +2,575.04 (Feb 3), +9,170.24 (Feb 4), and +8,448.33 (Feb 5).
- Immediately after the bottom, Feb 6 posted a heavy negative netflow (−16,289.12), followed by additional negative days (−1,038.44 and −3,973.15) into Feb 8, suggesting that the post-drop phase featured more coins leaving exchanges than entering.
- Across the full week, netflow summed to −8,017.16, meaning outflows outweighed inflows even though reserves still briefly climbed to a peak midweek before rolling over.
Relationships inside the numbers (not a forecast)
Within this seven-day sample, price and exchange reserves show a moderately negative correlation (−0.6492), meaning higher reserves tended to coincide with lower prices during this window. Price and netflow also skew negative (correlation −0.2783), reflecting that the strongest inflow cluster occurred during the decline, while the strongest outflow hit on the rebound day.
Reserves and netflow are positively correlated (0.6629), which fits the arithmetic of the dataset: inflow days (positive netflow) generally coincide with reserve increases, and outflow days with reserve decreases. Price volatility in this short run was high: the standard deviation of daily percent price changes (Feb 3–Feb 8) was 8.5414%, dominated by the −13.97% drop on Feb 5 and the +12.31% snapback on Feb 6.
Chart: Daily price, reserves, and flows (Feb 2–8)
What stands out in the table is the sequencing: reserves and netflows build into Feb 5 while price breaks down, then the largest reserve drop and largest net outflow land on Feb 6 during the rebound. This dataset doesn’t prove causality, but it does document a clean, time-stamped shift in exchange-side supply dynamics right after the week’s extreme price low. This data Based on Cryptoquant data points.


