
The latest on-chain activity across major blockchain networks reveals a week of mixed performance, with several ecosystems experiencing temporary growth before cooling toward the end of the period. Changes in total value locked (TVL), transaction counts, and active wallet participation indicate shifting market momentum and user behavior across networks.
Ethereum
Ethereum experienced notable fluctuations throughout the week. The network’s TVL began the period slightly above $52 billion and climbed steadily, reaching a peak of over $56 billion mid-week. This rise suggested renewed capital inflows into decentralized finance protocols and other applications built on the network.
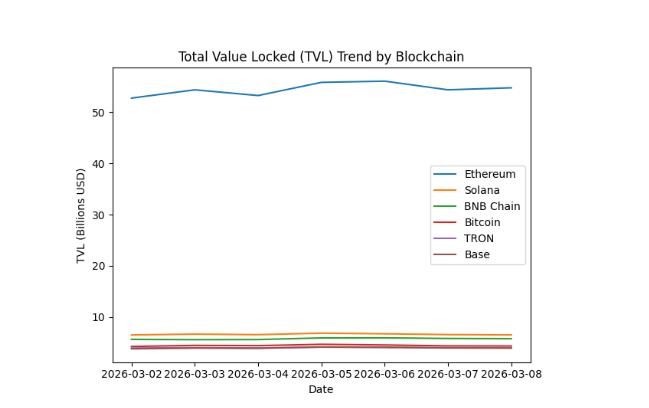
Ethereum’s TVL declined to roughly $54–55 billion, indicating some capital outflows or profit-taking after the earlier surge. Network activity also softened over the week. Daily active addresses gradually decreased from over 820,000 early in the week to just above 520,000 by the end. Transactions followed a similar pattern, dropping from around 2.2 million daily transactions to about 1.7 million. The decline suggests reduced user engagement despite strong liquidity levels earlier in the week.
Solana
Solana continued to demonstrate extremely high throughput compared with other networks. Daily transaction counts remained exceptionally large throughout the week, consistently exceeding 80 million transactions per day and peaking above 94 million at one point.
Active wallet participation also remained robust, reaching over 2.3 million active addresses mid-week before gradually declining toward the weekend. Despite this slight drop, Solana still maintained one of the highest participation levels among major chains.
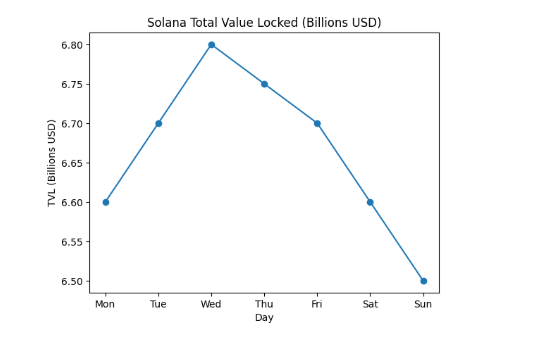
On the liquidity side, TVL moved within a relatively narrow range between $6.5 billion and $6.8 billion. The metric briefly climbed to the week’s high near the middle of the period before gradually easing back toward the lower end of the range. The stable range suggests that while user activity remains strong, large-scale capital movement into or out of the ecosystem has been relatively limited.
BNB Chain
BNB Chain displayed comparatively steady performance. Its TVL hovered around $5.6 billion to nearly $6 billion, briefly approaching the upper end of that range during the middle of the week before slightly declining.
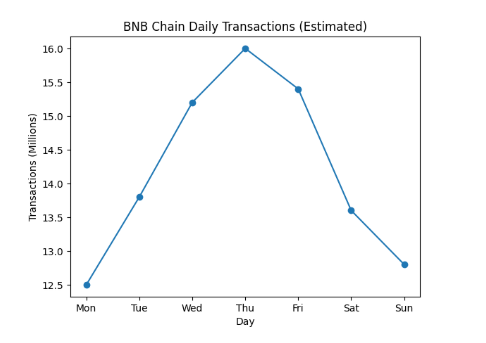
Transaction counts remained strong throughout the period, generally ranging between 12 million and 16 million transactions per day. Although activity tapered slightly toward the weekend, the network maintained consistent throughput, highlighting stable user demand for decentralized applications and trading activity.
Overall, BNB Chain’s metrics suggest a relatively stable ecosystem with modest growth followed by a mild cooling phase.
Bitcoin
Bitcoin-related DeFi liquidity experienced a noticeable rise during the middle of the week. The metric began near $4.3 billion, then climbed to a peak of roughly $4.7 billion before declining again in the final days.
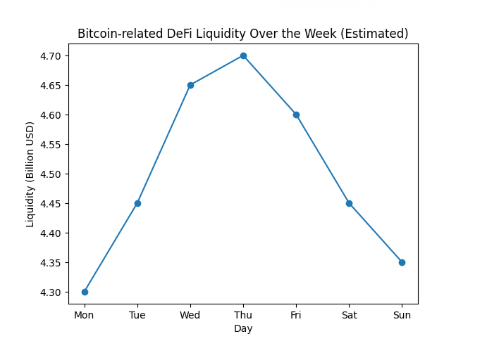
The temporary increase suggests that capital flowed into Bitcoin-based financial protocols or wrapped asset ecosystems during the early part of the week. However, the later pullback indicates that some of those inflows were not sustained.
Even with the late-week decline, the figures still remained slightly above the starting levels seen at the beginning of the period, signaling modest net growth overall.
TRON
TRON continued to stand out for its consistently high network usage. Daily active addresses remained above 3 million for most of the week, significantly exceeding activity levels on many other chains.
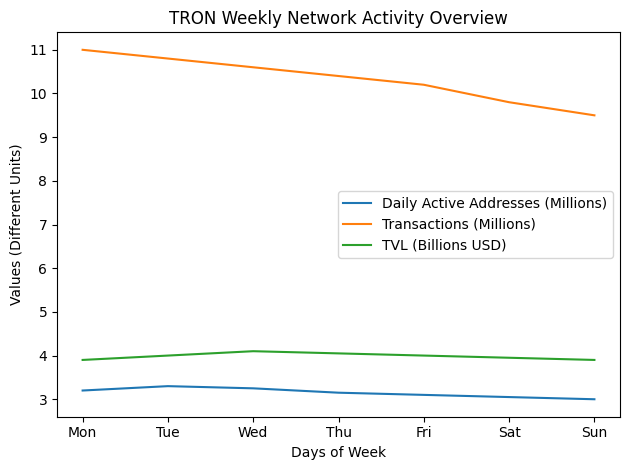
Transaction counts were also strong, staying around 10–11 million per day early in the period before gradually declining toward the weekend. Despite the drop, TRON still maintained substantial throughput.
TVL on the network moved between $3.9 billion and $4.1 billion, briefly reaching a weekly high before easing back toward the starting range. The relatively tight movement suggests stable liquidity within the ecosystem.
Base
The Base network showed notable growth in the first half of the week. Its TVL increased from roughly $3.8 billion to more than $4.1 billion, reflecting increased capital deployment within the ecosystem.
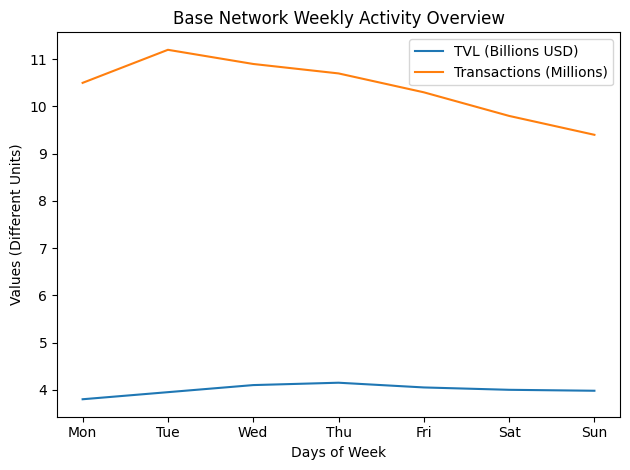
However, the momentum slowed later in the week as TVL declined slightly toward $4 billion. Despite the pullback, the network maintained higher liquidity than at the start of the period.
Transaction activity remained high throughout the week, with daily counts ranging roughly between 9 million and over 11 million transactions. While activity dipped slightly toward the end of the period, the network still maintained strong usage compared with many emerging chains.
Market Signals Mixed Across Ecosystems
Overall, the week highlighted diverging trends across major blockchain networks. Several ecosystems experienced capital inflows and higher activity in the early part of the period before momentum slowed later.
Ethereum and Base both showed mid-week liquidity growth followed by mild pullbacks. Solana maintained exceptional transaction throughput despite slight declines in participation near the end of the period. Meanwhile, TRON continued to demonstrate strong address activity, and BNB Chain maintained relatively stable performance.
These patterns suggest that while the broader blockchain sector remains active, user engagement and capital flows continue to shift dynamically across networks as traders and developers respond to changing market conditions.
Weekly Comparison: Feb 23–Mar 1 vs Mar 2–8
| Blockchain | Feb 23–Mar 1 TVL Range | Mar 2–8 TVL Range | Activity Trend | Transaction / User Trend |
|---|---|---|---|---|
| Ethereum | $52.0B – $54.8B | $52B → peak $56B → ~$54–55B | Mid-week capital inflow then mild outflow | Active addresses fell from ~820K to ~520K; transactions dropped from ~2.2M to ~1.7M |
| Solana | $6.26B – $6.62B | $6.5B – $6.8B | Slight liquidity growth then stabilization | Transactions stayed extremely high (80M–94M); active addresses peaked ~2.3M |
| BNB Chain | $5.40B – $5.70B | $5.6B – ~$6B | Moderate mid-week growth then slight cooling | Transactions stable around 12M–16M daily |
| Bitcoin | $4.26B – $4.52B | $4.3B → $4.7B → ~$4.4B | Short-term inflow followed by partial pullback | Activity remained within similar ranges |
| TRON | $4.00B – $4.24B | $3.9B – $4.1B | Liquidity remained tightly stable | Active addresses stayed above 3M; transactions ~10–11M daily |
| Base | $3.73B – $3.94B | $3.8B → $4.1B → ~$4B | Early-week growth then mild decline | Transactions strong at ~9M–11M |
The March 2–8 period showed slightly higher peak liquidity across several chains compared with the previous week. Ethereum and Base recorded temporary TVL increases, while Solana maintained the highest transaction throughput. BNB Chain and TRON remained relatively stable, and Bitcoin saw a short mid-week rise in DeFi liquidity before returning closer to earlier levels, for a detailed look at the previous week’s blockchain activity (Feb 23 – Mar 1).


