
The week of February 2–8, 2026 marked a synchronized downturn across the crypto market, with prices, total value locked (TVL), and several on-chain activity metrics declining simultaneously across all major blockchain networks. Bitcoin, Ethereum, Solana, BNB Smart Chain, Tron, and Base each recorded their lowest weekly TVL on February 6, highlighting a market-wide risk-off event rather than isolated chain-specific weakness.
While token prices and TVL contracted, trading volumes, DEX activity, and chain fees surged mid-week, indicating heightened participation during the selloff. This divergence between falling prices and rising activity suggests aggressive repositioning by market participants rather than a simple liquidity freeze.
Market Overview
Bitcoin declined 9.9% over the week, closing at $69,297, while Ethereum fell 7.8% to $2,091. Solana posted the steepest loss among major assets, dropping 13.1% to $87.67. Across all six tracked chains, TVL fell between 3.3% and 12.6%, with February 6 emerging as the point of maximum stress.
Despite these declines, on-chain usage metrics such as DEX volume, trading volume, and fees peaked between February 5 and 6, reflecting elevated transaction demand during the drawdown, as per data’s from DeFiLlama Chains Dashboard.
Bitcoin: Price Decline Accompanied by Volume Spike
Bitcoin opened the week at $76,937 and briefly rallied to a high of $78,768 on February 3. From that point, sustained selling pressure pushed BTC to a weekly low of $62,854 on February 6 before a partial recovery into the weekend.
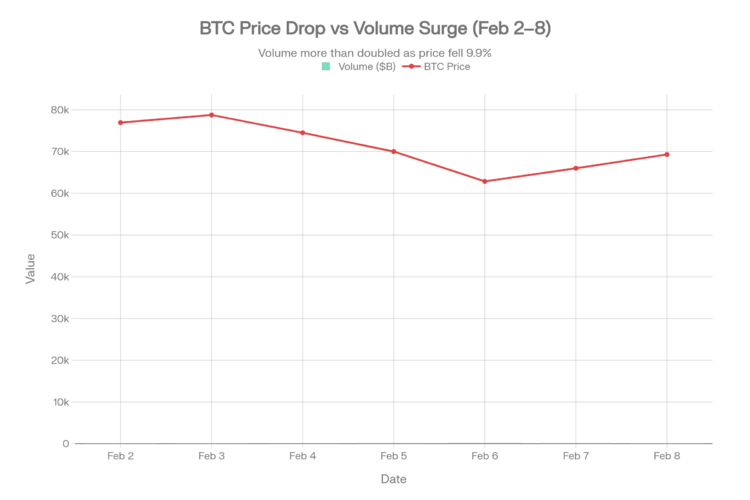
Trading volume surged sharply during the selloff. Daily BTC volume climbed from $58.3 billion on February 2 to a weekly peak of $142.4 billion on February 6, more than doubling within four days. Elevated volume persisted on February 7 before normalizing by week’s end, suggesting both forced selling and dip-buying activity.
Bitcoin’s TVL declined 10.4%, falling from $5.79 billion to $5.19 billion over the week. Network participation also softened, with active addresses peaking at 865,167 on February 5 before dropping to 555,675 by February 8.
Ethereum: Largest TVL Drawdown in Absolute Terms
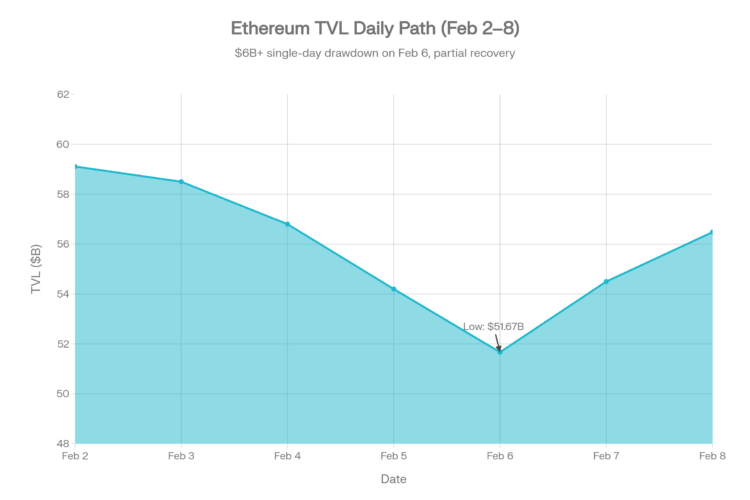
Ethereum remained the largest chain by TVL but experienced a significant contraction during the week. TVL fell from $59.11 billion on February 2 to a weekly low of $51.67 billion on February 6, representing a single-day drawdown of more than $6 billion. By February 8, TVL had partially recovered to $56.48 billion, still down 4.4% week-over-week.
ETH price followed a similar trajectory. After opening at $2,269, ETH peaked at $2,345 on February 3, then declined sharply to $1,821 on February 6 before rebounding into the weekend.
On-chain demand intensified during the downturn. Ethereum chain fees spiked to $3 million on February 5 and remained elevated on February 6, signaling increased transaction urgency during the selloff.
Solana: Steepest Price Drop, Strongest DEX Activity
Solana recorded the largest percentage price decline among major assets, falling 13.1% from $100.90 to $87.67. The token reached its weekly low of $78.50 on February 6, the same day Solana’s TVL bottomed.
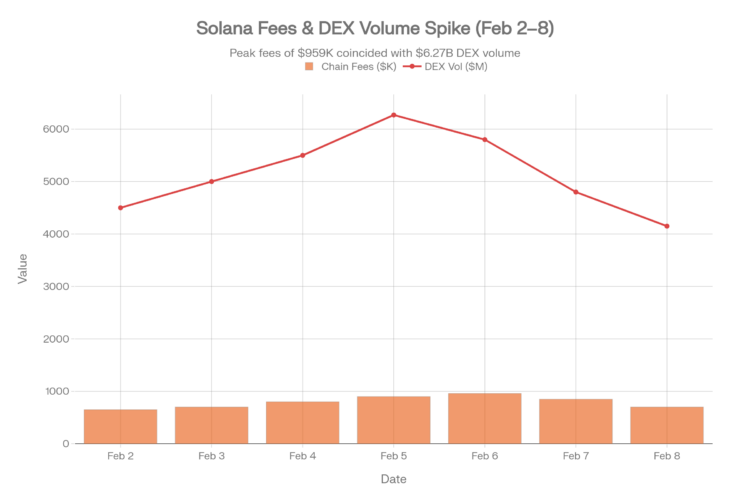
TVL on Solana dropped 12.6%, declining from $7.41 billion to $6.48 billion. Chain fees spiked to $959,463 on February 6, the highest level for the week, reflecting increased network usage despite falling prices.
Solana stood out in decentralized exchange activity. Weekly DEX volume reached $36.02 billion, nearly double Ethereum’s $20.11 billion for the same period. Daily DEX volume peaked at $6.27 billion on February 5, while perpetual futures volume also hit a weekly high of $2.36 billion that day. This confirms Solana’s continued dominance in high-frequency and speculative on-chain trading, even during market stress.
BNB Smart Chain: Activity Peaks Then Fades
BNB Smart Chain experienced a 9.2% TVL decline, with TVL falling from $6.07 billion to $5.51 billion over the week. User activity followed a similar pattern to other chains, peaking mid-week before tapering off.
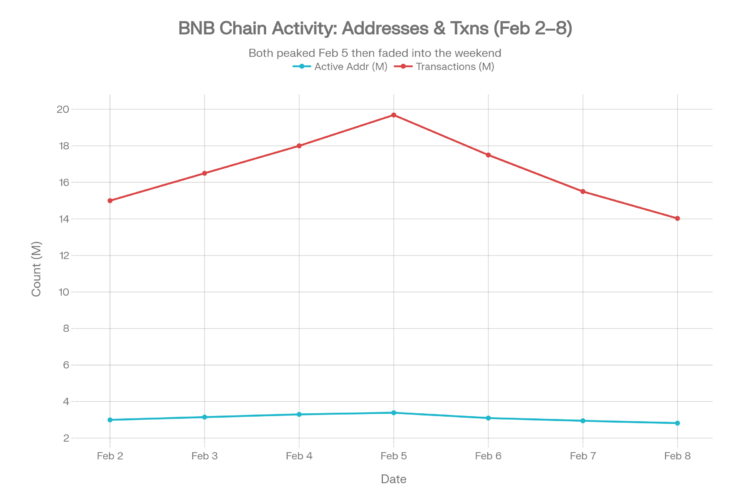
Active addresses reached a high of 3.39 million on February 5, coinciding with the highest daily transaction count of 19.69 million. By February 8, active addresses had declined to 2.82 million, and daily transactions fell to 14.03 million.
DEX volume on BSC peaked at $2.87 billion on February 5 before declining steadily into the weekend. Stablecoin market capitalization remained relatively flat throughout the week, fluctuating narrowly between $13.80 billion and $13.82 billion.
Tron: Defensive Stability Through Stablecoins
Tron displayed the most defensive profile among the tracked chains. While TVL declined 3.3%, from $4.25 billion to $4.11 billion, this was the smallest percentage drop across all six networks.
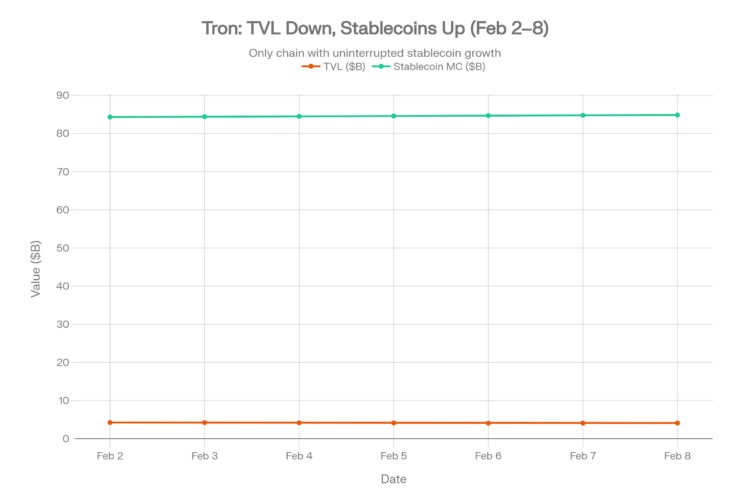
In contrast to declining TVL, Tron’s stablecoin market cap increased consistently throughout the week, rising from $84.31 billion to $84.86 billion. Tron was the only chain where a major metric showed uninterrupted growth during the period.
Active addresses declined modestly from 3.66 million to 3.26 million, while TRX price remained range-bound between $0.27 and $0.29, showing limited volatility compared to other major assets.
Base: Layer 2 Activity Spikes During Selloff
Base, as an emerging Layer 2 network, experienced a 4.2% TVL decline, with TVL slipping from $4.18 billion to $4.01 billion. Despite the contraction, on-chain usage spiked mid-week.
DEX volume peaked at $2.25 billion on February 5 before falling to $720 million by February 8. Daily transactions surged to 19.65 million on February 5, the highest level for the week, then declined to 9.75 million by week’s end. Stablecoin market cap remained steady, ranging between $4.62 billion and $4.69 billion.
Cross-Chain TVL Summary
| Chain | TVL (Feb 2) | TVL (Feb 8) | Weekly Change |
| Ethereum | $59.11b | $56.48b | −4.4% |
| Solana | $7.41b | $6.48b | −12.6% |
| BNB Smart Chain | $6.07b | $5.51b | −9.2% |
| Bitcoin | $5.79b | $5.19b | −10.4% |
| Tron | $4.25b | $4.11b | −3.3% |
| Base | $4.18b | $4.01b | −4.2% |
Overall
The week of February 2–8 highlighted a clear and consistent pattern across the crypto ecosystem. Prices and TVL declined across every major chain, while trading volume, DEX activity, and fees surged during the selloff, particularly on February 5 and 6. This combination points to elevated market participation during stress rather than a collapse in network usage.
Solana’s dominance in decentralized trading activity and Tron’s growing stablecoin base stood out as notable divergences amid the broader contraction. Overall, the data reflects a coordinated market drawdown concentrated in a narrow time window, reinforcing the view that February 6 represented a systemic risk-off moment across the crypto market.
When viewed alongside Blockchain Metrics January 2026, the February 2–8 drawdown appears less like an isolated shock and more like a continuation of pressures already forming earlier in the year.


