Introduction
Researching DeFi projects can be challenging, especially for beginners. New protocols launch frequently, influencers promote trending opportunities, and social media is often filled with conflicting opinions. In such a fast-moving environment, it becomes difficult to identify which projects are genuinely growing and which are driven mainly by hype.
This is where DefiLlama becomes a valuable research tool. It provides transparent access to real on-chain data across multiple blockchains, helping users evaluate DeFi protocols based on actual usage rather than speculation. By focusing on metrics such as Total Value Locked (TVL), revenue, trading volume, and stablecoin flows, DefiLlama makes it easier to understand the real performance of decentralized finance projects.
How to Use DefiLlama for DeFi Research
Researching DeFi projects can be difficult, especially for beginners. New protocols launch every day, influencers promote trending opportunities, and social media is filled with conflicting opinions. The main challenge is identifying which projects are actually growing and which ones are driven mainly by hype. This is where DefiLlama becomes useful.
DefiLlama is a widely used DeFi analytics platform that helps users understand real on-chain activity across multiple blockchains. Instead of relying on price speculation, it focuses on metrics like TVL, revenue, trading volume, and stablecoin flows.
What is DefiLlama?
DefiLlama is a blockchain analytics platform that tracks thousands of DeFi protocols across hundreds of networks. It is designed to help users evaluate real usage rather than market sentiment or token price movements.
It is commonly used to analyze lending protocols, decentralized exchanges, staking platforms, bridges, and yield farming applications. The goal is to understand how much capital is being used and how activity changes over time.


Key things it helps you track:
- Protocol-level liquidity and growth
- Cross-chain DeFi activity
- Real usage instead of hype
Understanding TVL (Total Value Locked)
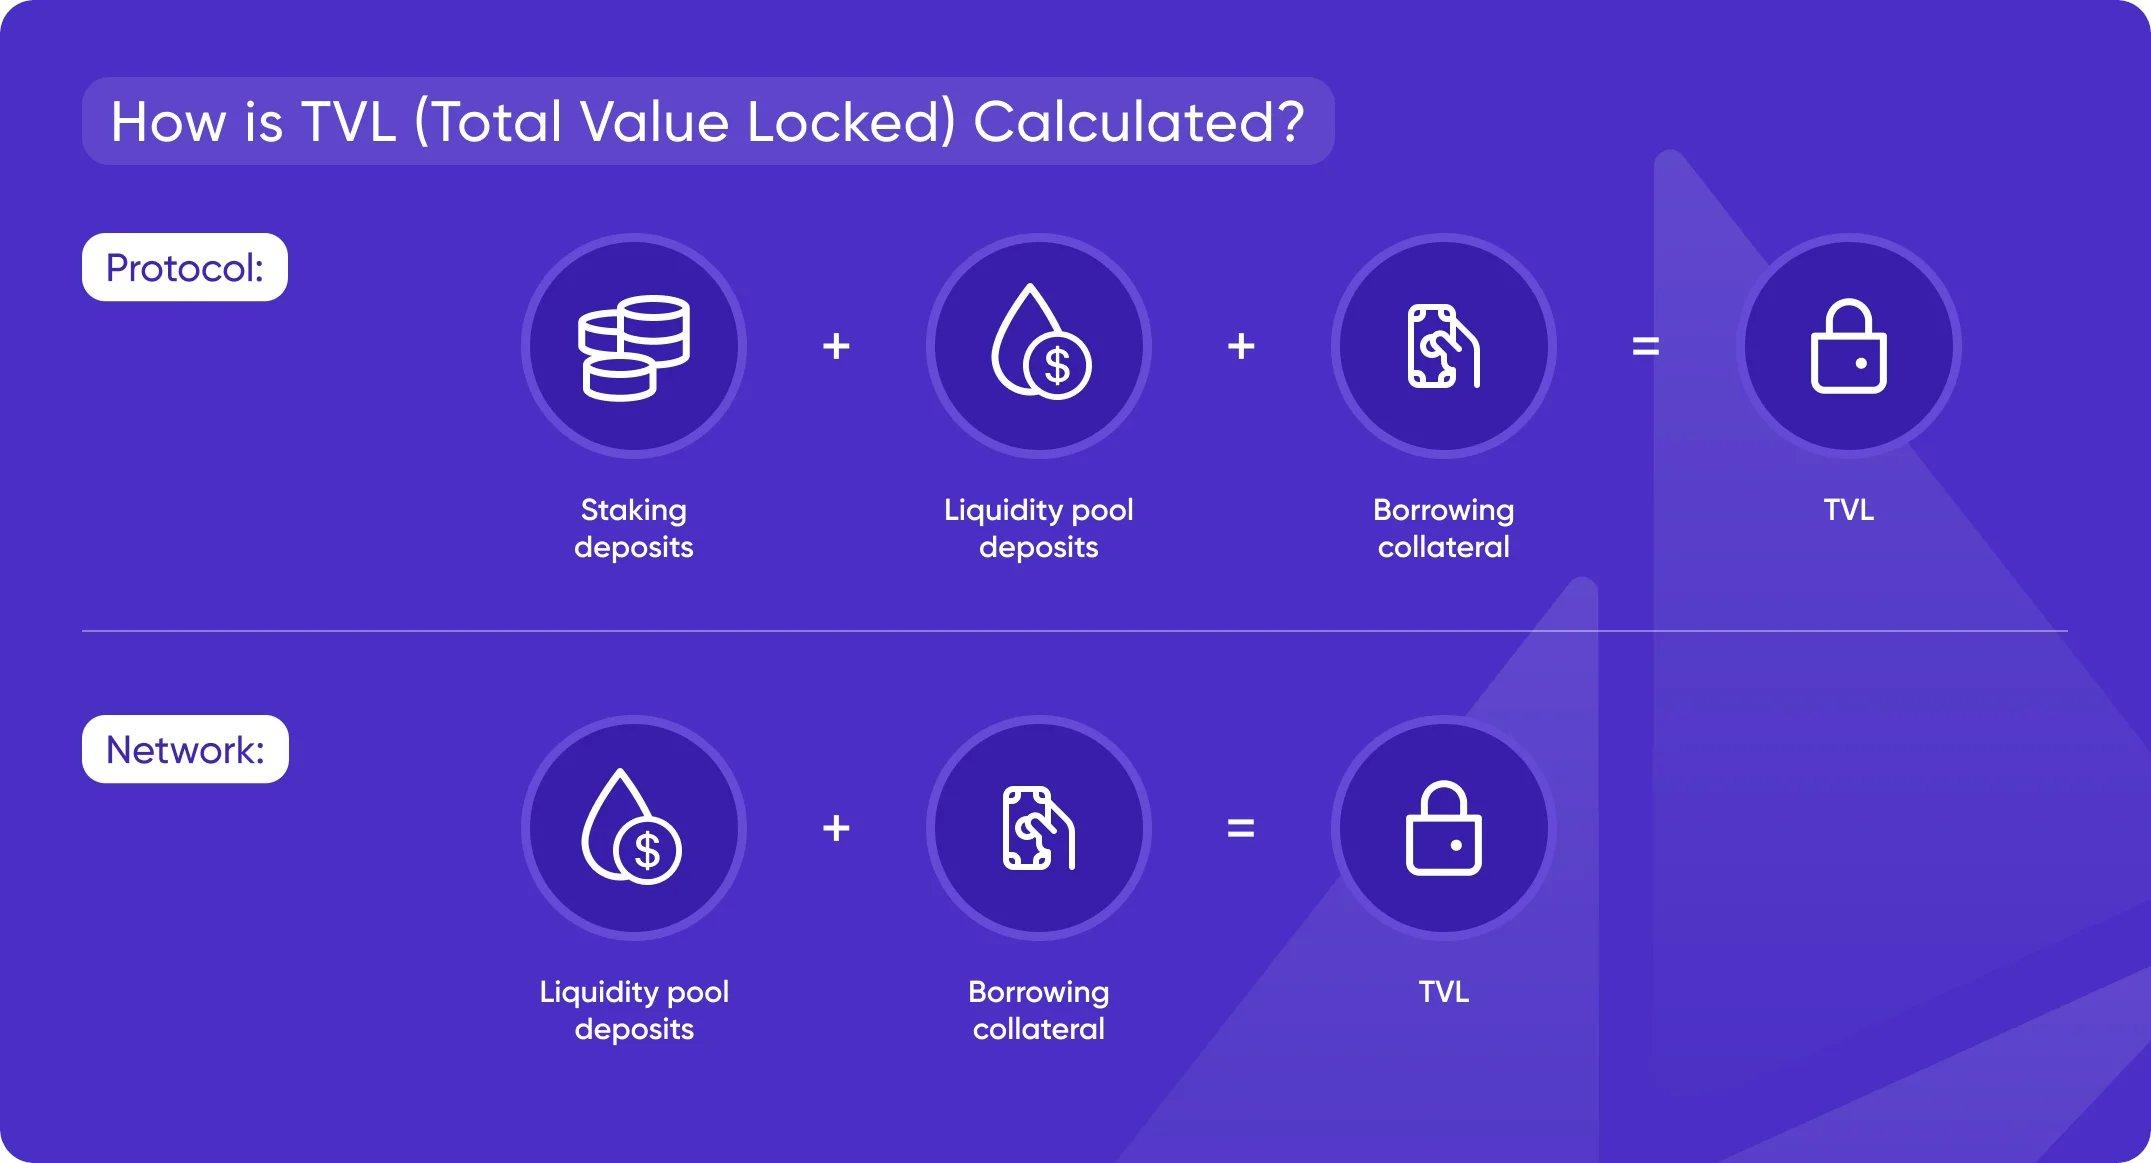
TVL is one of the most important metrics in DeFi. It represents the total value of assets deposited into a protocol’s smart contracts.
For example, if users deposit $500 million into a lending protocol, its TVL is $500 million. This number helps indicate how much capital is actively being used within a protocol.
TVL should be interpreted carefully because it does not always represent organic demand.
- Rising TVL may indicate adoption or incentive programs
- Falling TVL may indicate capital outflows
- Stable TVL may suggest mature or slow growth
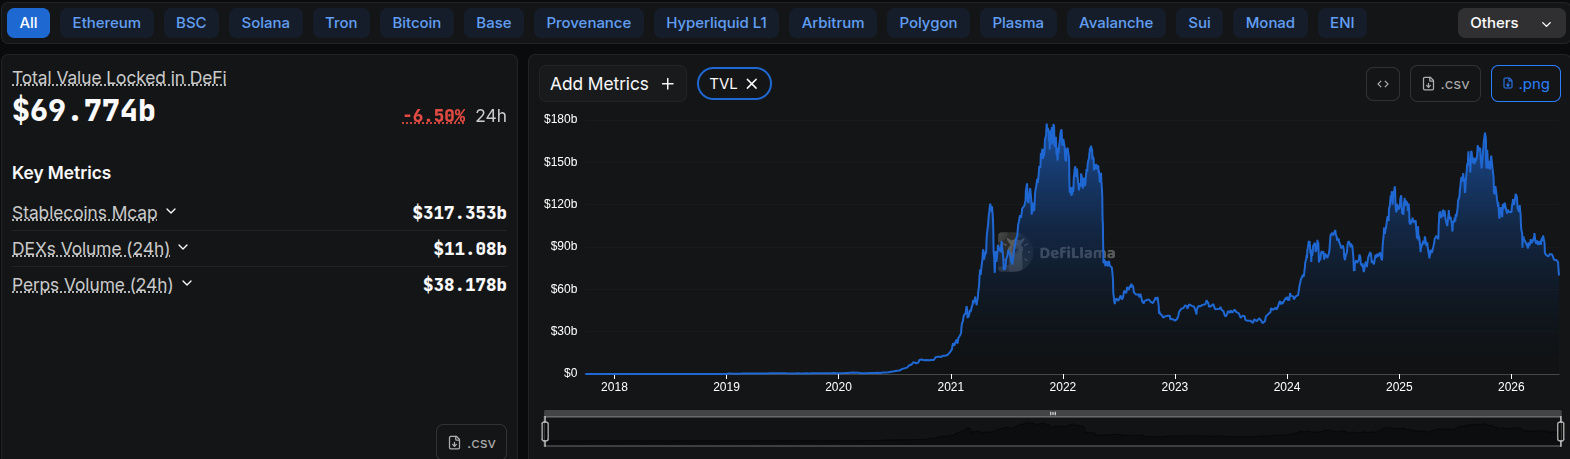
Step 1: Explore the Homepage
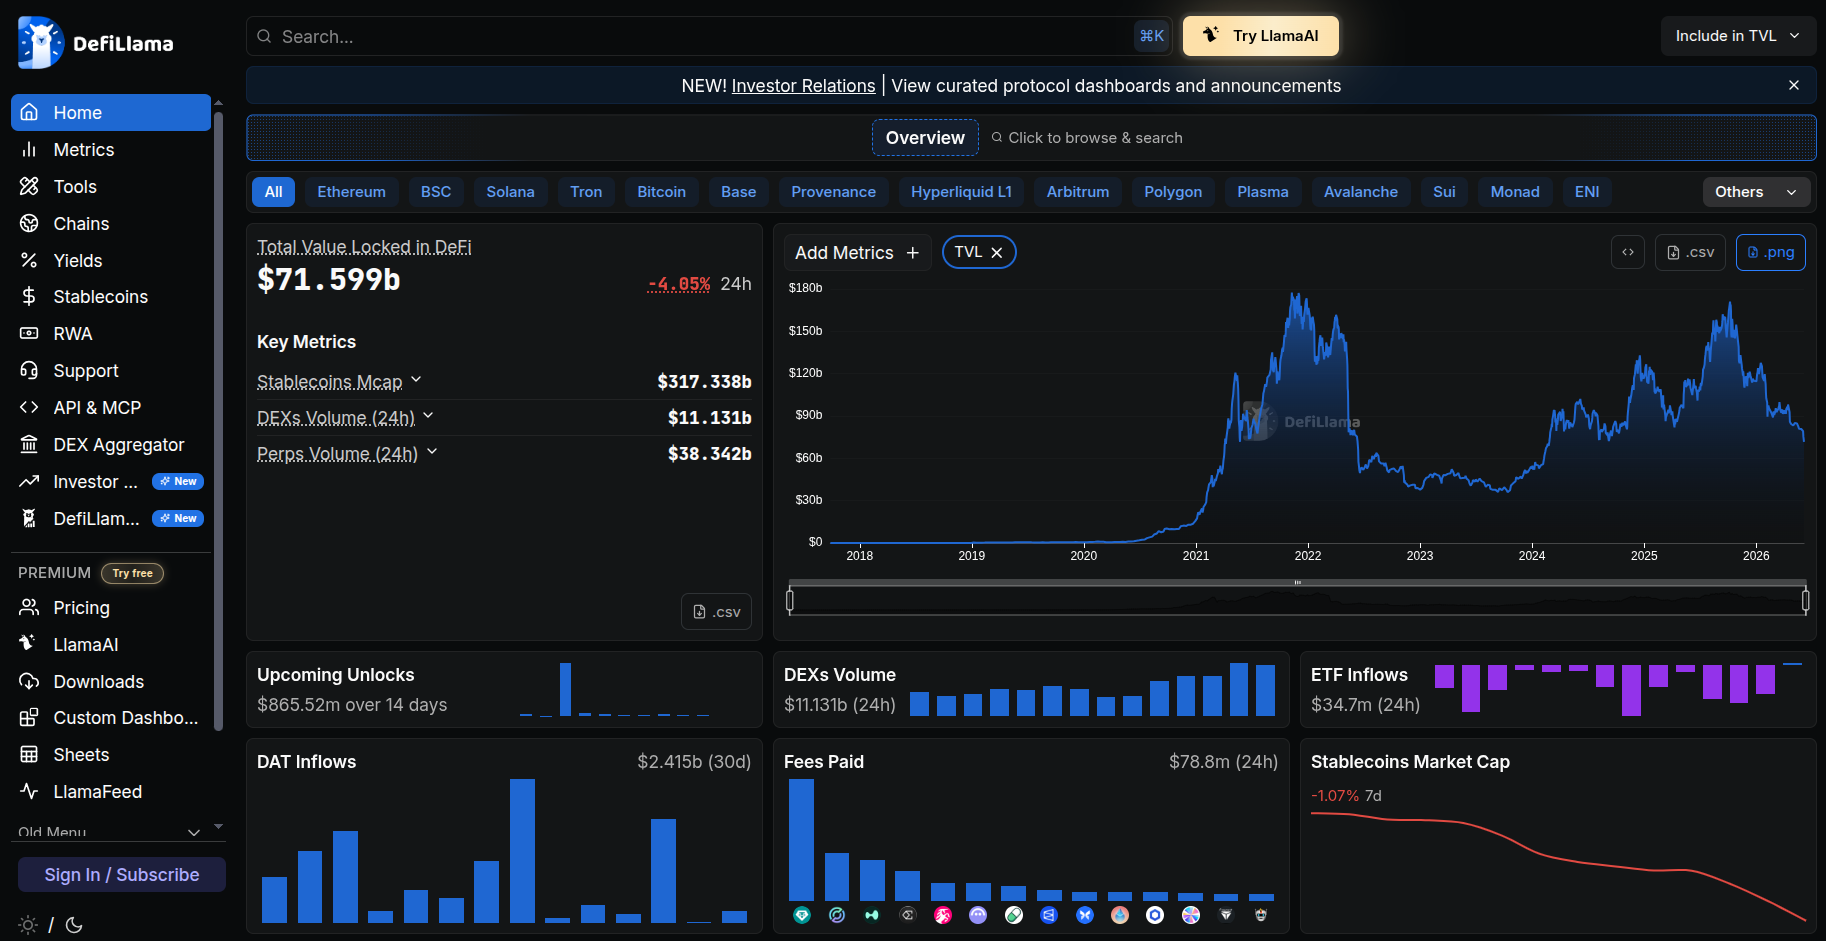
The DefiLlama homepage provides a macro overview of the entire DeFi ecosystem. It shows total market TVL, top protocols, and blockchain rankings.
This section is useful for understanding overall market conditions and identifying where liquidity is concentrated. It also helps highlight dominant ecosystems such as Ethereum or emerging Layer 2 networks.
Step 2: Analyze Individual Protocols
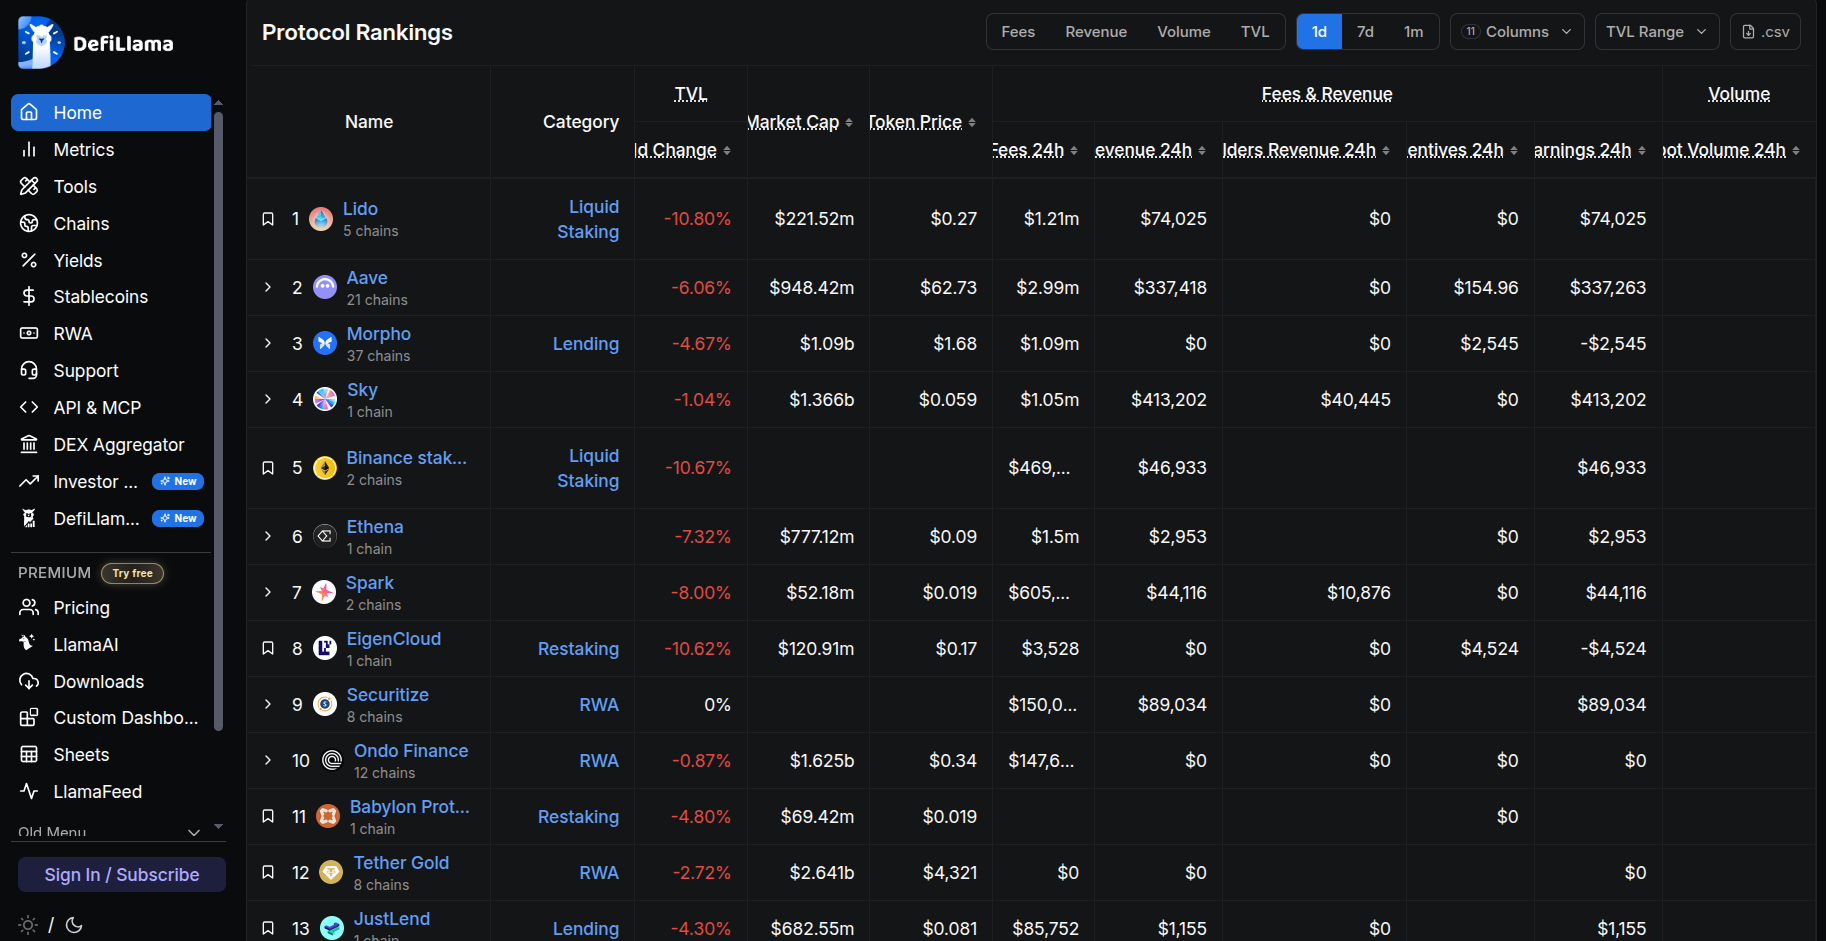
You can search for any protocol such as Aave, Uniswap, or newer DeFi applications. Each protocol page provides detailed data on performance and usage.
On a typical protocol page, you will find:
- TVL history and growth trends
- Revenue and fee data
- Supported blockchain networks
This helps you understand whether a protocol is growing based on real activity rather than social media attention.
Step 3: Study TVL Trends
The TVL chart is one of the most useful tools for understanding protocol behavior over time. It shows whether capital is flowing into or out of a project.
A rising trend usually indicates adoption, while a declining trend suggests users are leaving or incentives are fading. Sudden spikes often come from liquidity incentives rather than organic growth. The most important insight is that trend direction matters more than the absolute value of TVL
Step 4: Compare Blockchain Ecosystems
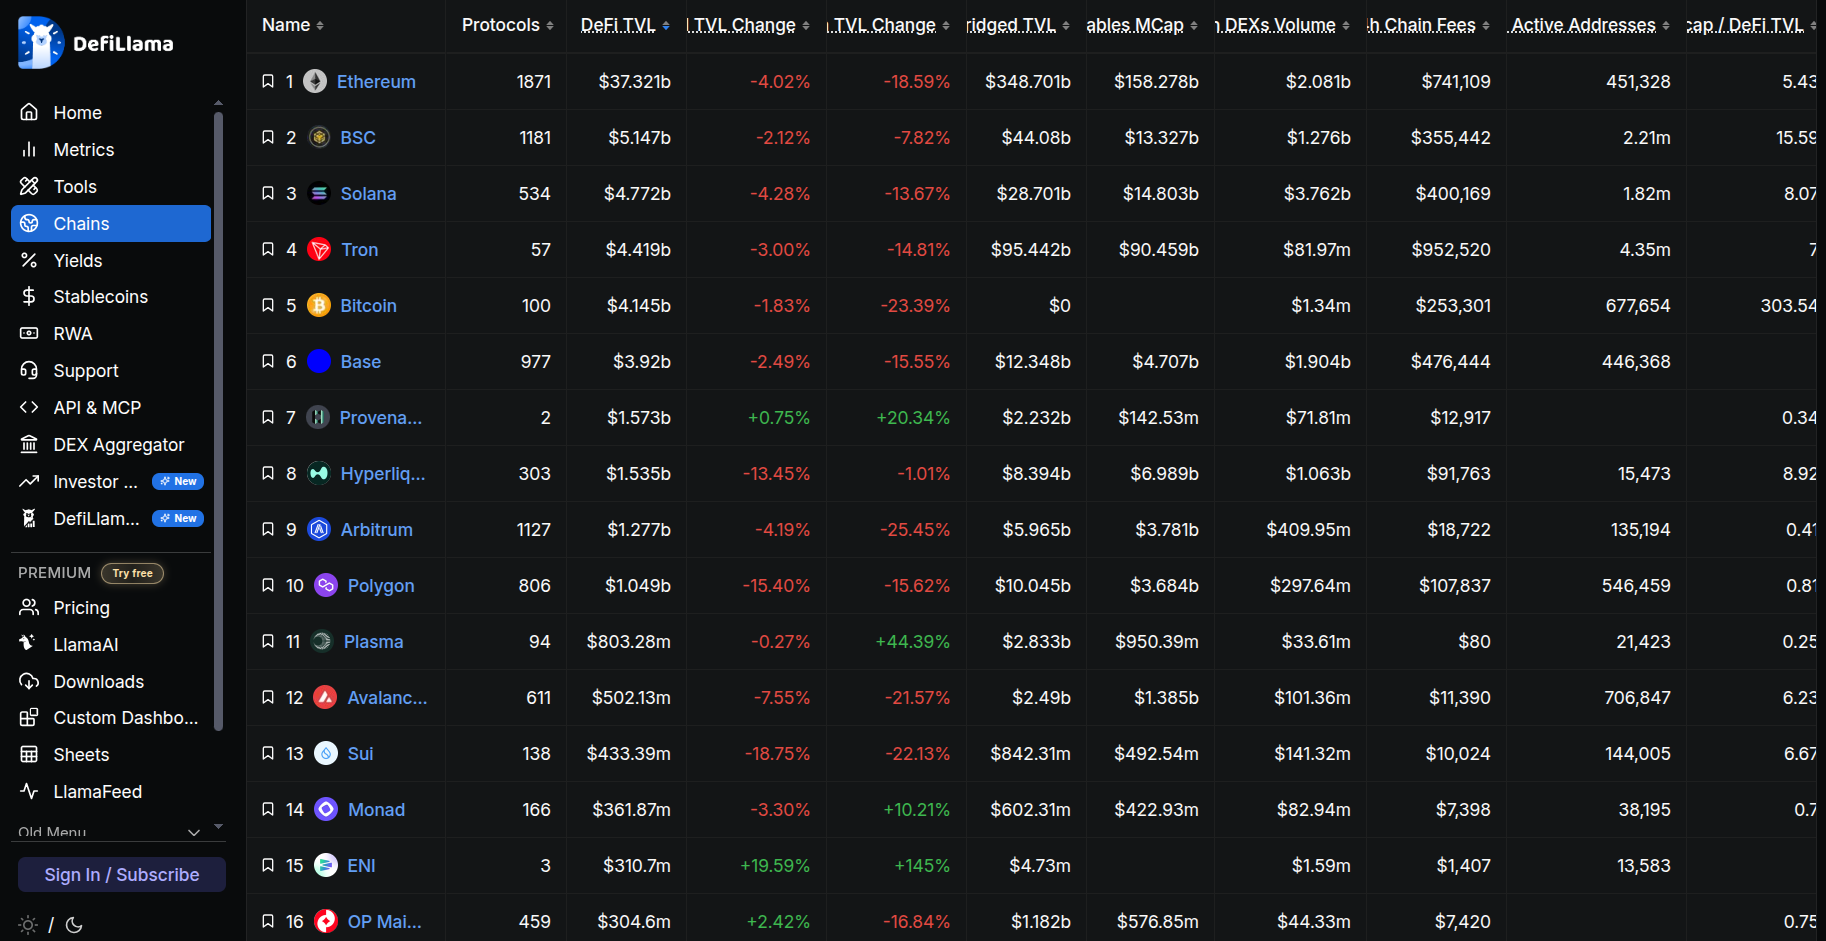
The Chains section allows users to compare different blockchain ecosystems like Ethereum, Solana, Arbitrum, Base, and BNB Chain. This helps identify where DeFi activity is concentrated.
It is useful for spotting emerging ecosystems and tracking capital movement across chains. However, changes in chain TVL can sometimes reflect liquidity shifting rather than entirely new capital entering the system.
Step 5: Track Stablecoins
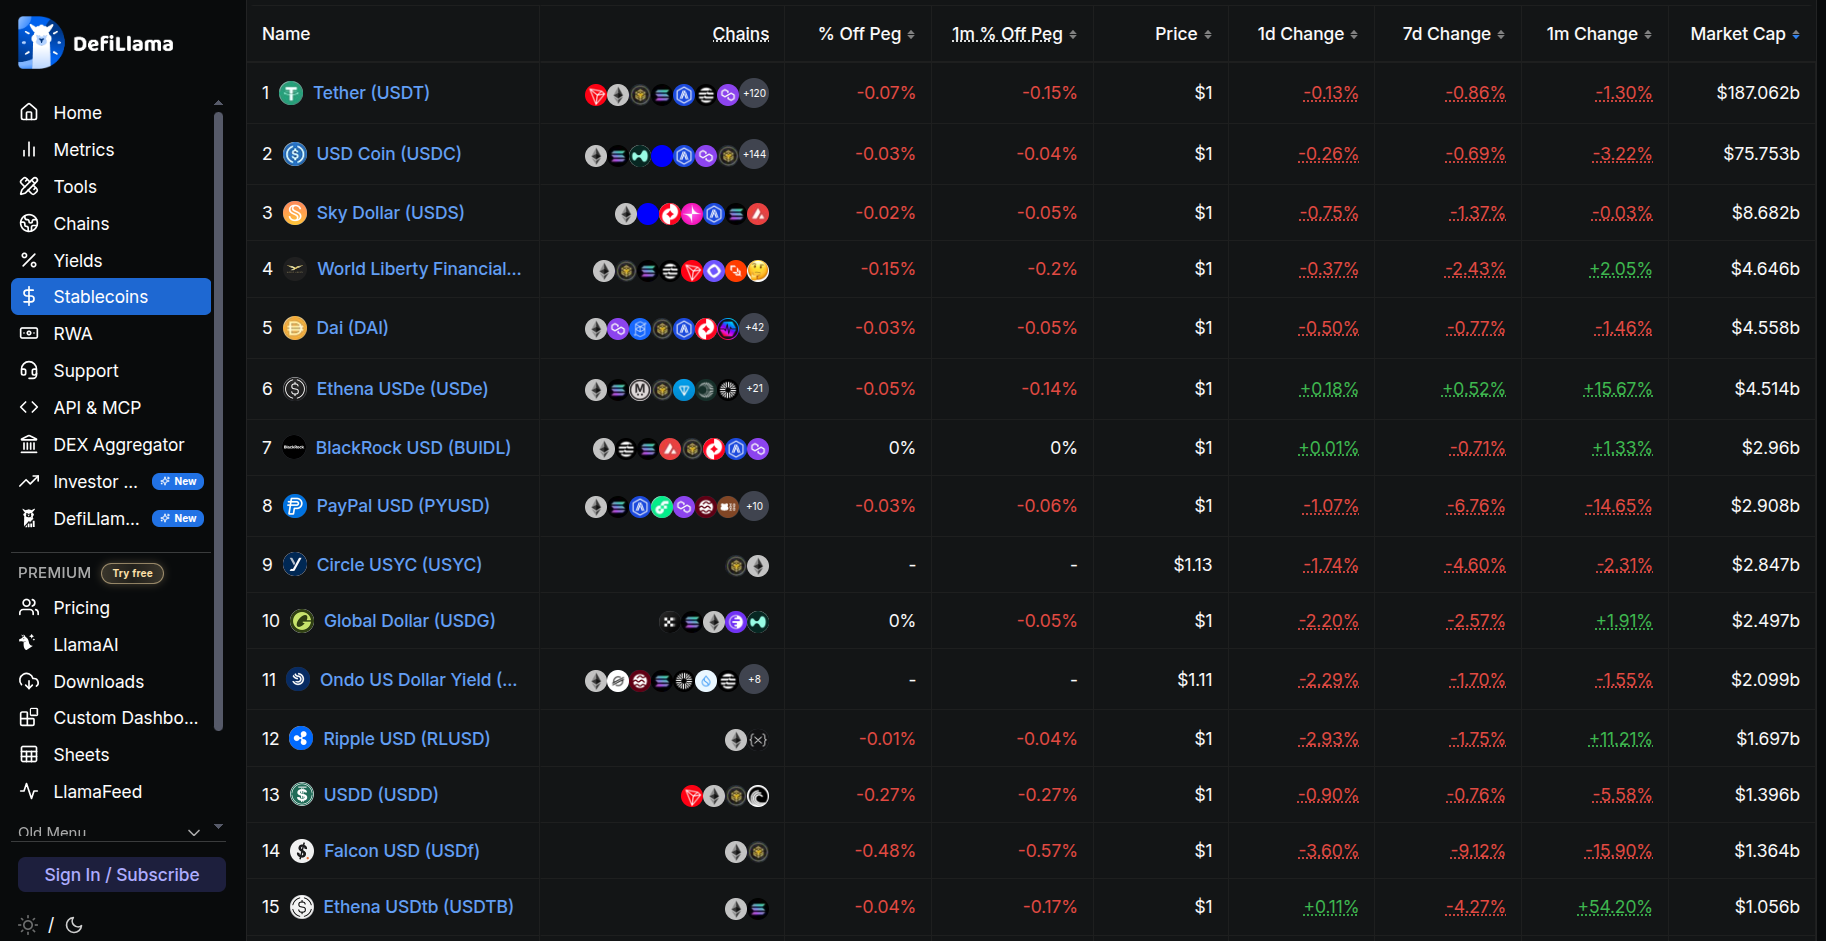
Stablecoins such as USDT and USDC represent liquidity in the crypto ecosystem. Monitoring their supply helps understand broader market conditions.
- Increasing stablecoin supply suggests more liquidity available in the system
- Decreasing supply suggests reduced market activity or capital exit
- Stable supply often reflects market consolidation
Stablecoin trends are often used as early indicators of market sentiment.
Step 6: Analyze Volume, Fees, and Revenue
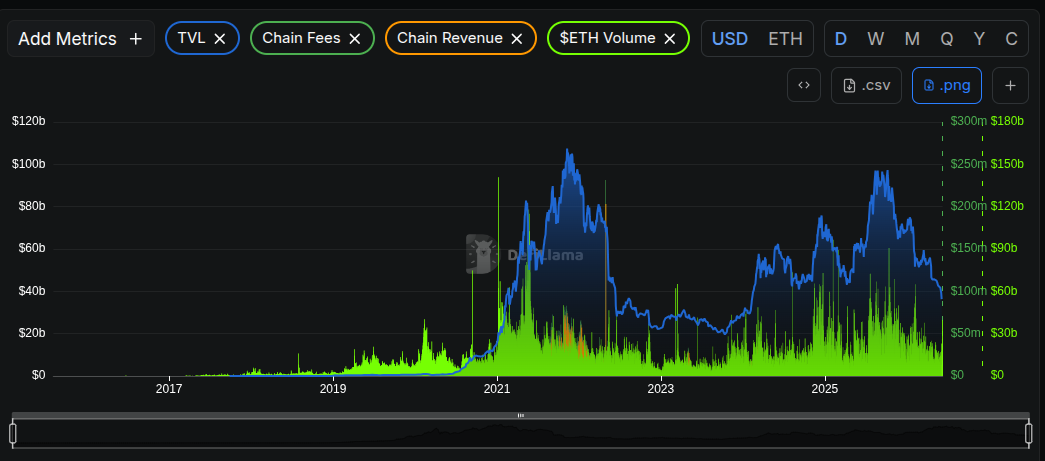
Beyond TVL, it is important to analyze how actively a protocol is being used. Metrics like trading volume, fees, and revenue give a clearer picture of real demand.
TVL shows how much capital is deposited, but usage metrics show how that capital is being used. A strong protocol usually shows both healthy liquidity and consistent revenue generation.
How to Research a New DeFi Project
Researching a new DeFi project can be confusing for beginners because the space moves fast and is often driven by hype. A structured, data-driven approach helps you understand whether a protocol has real usage or just temporary attention. Instead of focusing on price or social media trends, I rely on on-chain metrics and clear comparison steps to evaluate a project properly.
Step-by-Step Research Process
- Check TVL (Total Value Locked): Start by looking at how much capital is deposited in the protocol. This helps you understand the overall size and user trust in the project.
- Analyze TVL Trend: Don’t just look at the number, check if it is growing, falling, or stable over time. Growth often signals adoption, while decline may indicate capital outflow.
- Compare with Competitors: Evaluate similar protocols in the same category (DEX, lending, staking, etc.) to see if the project is actually competitive.
- Review Revenue & Fees: Look at how much money the protocol is earning. Strong revenue often indicates real usage rather than incentive-driven activity.
- Check Trading Activity: High volume and consistent activity suggest users are actively interacting with the platform.
- Analyze Chain Distribution: See which blockchains the protocol operates on and how liquidity is spread across them.

The goal of this process is to separate real adoption from short-term hype. No single metric is enough on its own, but combining TVL, revenue, volume, and chain activity gives a clearer picture of a project’s health. A consistent, data-based approach makes DeFi research more reliable and easier to understand, especially for beginners.
Limitations of DefiLlama
DefiLlama is an excellent platform for researching DeFi projects, but it is important to understand its limitations. Metrics such as Total Value Locked (TVL), fees, and revenue provide valuable insights, yet they do not always tell the full story. TVL can be influenced by temporary incentives, and cross-chain data may sometimes mask important differences in protocol performance across individual networks. As a result, users should avoid relying on a single metric when evaluating a project.
- TVL can be boosted by short-term reward programs rather than genuine user adoption.
- Revenue and fee data may be incomplete for some protocols.
- Cross-chain activity can make overall protocol trends difficult to interpret.
Additionally, DefiLlama focuses primarily on on-chain data, which means it cannot measure factors such as community strength, developer activity, partnerships, or future product developments. For the best results, investors should use DefiLlama as a starting point and combine its data with project documentation, security audits, governance discussions, and broader market research before making investment decisions.
Another limitation is that on-chain metrics do not provide a complete view of a project’s tokenomics. For example, future token unlocks, team allocations, and investor vesting schedules can create significant selling pressure that may not be visible in TVL or revenue data. Understanding a project’s vesting schedules and lockup mechanisms can help investors identify potential risks beyond the metrics displayed on DefiLlama.
Conclusion
DefiLlama is one of the most valuable tools for DeFi research because it provides transparent, real-time data across multiple blockchains. Instead of relying on social media trends or market hype, users can analyze key metrics such as Total Value Locked (TVL), protocol revenue, fees, and ecosystem growth to better understand how a project is performing.
By using data-driven insights, investors and researchers can make more informed decisions and identify projects with genuine adoption and long-term potential. New to DeFi? Explore our complete DeFi Basics section to learn about TVL, liquidity pools, yield farming, staking, and other essential concepts before researching protocols with DefiLlama.
After learning how to use DefiLlama, the next step is understanding how to interpret blockchain data in real-world market conditions. To see these metrics in action, explore our weekly on-chain metrics report, monthly blockchain analysis, and Q1 2026 ecosystem report, which demonstrate how network activity, liquidity flows, and user adoption trends can be analyzed across major blockchains.
The key takeaway is simple: successful DeFi research is built on facts and on-chain data, not narratives or speculation.
FAQs
1. Is DefiLlama free?
Yes, it is completely free to use.
2. Can beginners use it?
Yes, beginners can start with TVL, rankings, and stablecoin data.
3. Is TVL enough to judge a project?
No, it should be combined with revenue, volume, and usage metrics.
4. Can it help find new projects?
Yes, many users discover emerging protocols and trends using DefiLlama.


